Dish Network 2014 Annual Report Download - page 66
Download and view the complete annual report
Please find page 66 of the 2014 Dish Network annual report below. You can navigate through the pages in the report by either clicking on the pages listed below, or by using the keyword search tool below to find specific information within the annual report.-
 1
1 -
2
-
3
-
4
-
5
-
6
-
7
-
8
-
9
-
10
-
11
-
12
-
13
-
14
-
15
-
16
-
17
-
18
-
19
-
20
-
21
-
22
-
23
-
24
-
25
-
26
-
27
-
28
-
29
-
30
-
31
-
32
-
33
-
34
-
35
-
36
-
37
-
38
-
39
-
40
-
41
-
42
-
43
-
44
-
45
-
46
-
47
-
48
-
49
-
50
-
51
-
52
-
53
-
54
-
55
-
 56
56 -
 57
57 -
 58
58 -
 59
59 -
 60
60 -
 61
61 -
 62
62 -
 63
63 -
 64
64 -
 65
65 -
 66
66 -
 67
67 -
 68
68 -
 69
69 -
 70
70 -
 71
71 -
 72
72 -
 73
73 -
 74
74 -
 75
75 -
 76
76 -
77
-
78
-
79
-
80
-
81
-
82
-
83
-
84
-
85
-
86
-
87
-
88
-
89
-
90
-
91
-
92
-
93
-
94
-
95
-
96
-
97
-
98
-
99
-
100
-
101
-
102
-
103
-
104
-
105
-
106
-
107
-
108
-
109
-
110
-
111
-
112
-
113
-
114
-
115
-
116
-
117
-
118
-
119
-
120
-
121
-
122
-
123
-
124
-
125
-
126
-
127
-
128
-
129
-
130
-
131
-
132
-
133
-
134
-
135
-
136
-
137
-
138
-
139
-
140
-
141
-
142
-
143
-
144
-
145
-
146
-
147
-
148
-
149
-
150
-
151
-
152
-
153
-
154
-
155
-
156
-
157
-
158
-
159
-
160
-
161
-
162
-
163
-
164
-
165
-
166
-
167
-
168
-
169
-
170
-
171
-
172
-
173
-
174
-
175
-
176
-
177
-
178
-
179
-
180
-
181
-
182
-
183
-
184
-
185
-
186
-
187
-
188
 |
 |

56
56
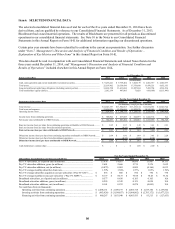
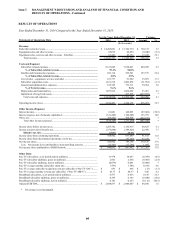
Item 6. SELECTED FINANCIAL DATA
The selected consolidated financial data as of and for each of the five years ended December 31, 2014 have been
derived from, and are qualified by reference to our Consolidated Financial Statements. As of December 31, 2013,
Blockbuster had ceased material operations. The results of Blockbuster are presented for all periods as discontinued
operations in our consolidated financial statements. See Note 10 in the Notes to our Consolidated Financial
Statements in this Annual Report on Form 10-K for additional information regarding our discontinued operations.
Certain prior year amounts have been reclassified to conform to the current year presentation. See further discussion
under “Item 7. Management’s Discussion and Analysis of Financial Condition and Results of Operations –
Explanation of Key Metrics and Other Items” in this Annual Report on Form 10-K.
This data should be read in conjunction with our Consolidated Financial Statements and related Notes thereto for the
three years ended December 31, 2014, and “Management’s Discussion and Analysis of Financial Condition and
Results of Operations” included elsewhere in this Annual Report on Form 10-K.
Balance Sheet Data 2014 2013 2012 2011 2010
Cash, cash equivalents and current marketable investment securities................................................ 9,236,241$ 9,739,404$ 7,205,379$ 2,001,917$ 2,940,377$
Total assets......................................................................................................................................... 22,107,462 20,356,430 17,379,608 11,470,231 9,632,153
Long-term debt and capital lease obligations (including current portion).......................................... 14,463,780 13,631,686 11,887,684 7,492,764 6,514,936
Total stockholders' equity (deficit)..................................................................................................... 2,012,134 997,005 71,628 (419,003) (1,133,443)
As of December 31,
(In thousands)
Statements of Operations Data 2014 2013 2012 2011 2010
Total revenue..................................................................................................................................... 14,643,387$ 13,904,865$ 13,181,334$ 13,074,063$ 12,640,744$
Total costs and expenses.................................................................................................................... 12,818,936 12,556,686 11,922,976 10,145,080 10,699,916
Operating income (loss)..................................................................................................................... 1,824,451$ 1,348,179$ 1,258,358$ 2,928,983$ 1,940,828$
Income (loss) from continuing operations.......................................................................................... 928,902$ 837,089$ 662,919$ 1,522,374$ NA
Net income (loss) attributable to DISH Network............................................................................... 944,693$ 807,492$ 636,687$ 1,515,907$ 984,729$
Basic net income (loss) per share from continuing operations attributable to DISH Network........... 2.05$ 1.87$ 1.49$ 3.41$ 2.21$
Basic net income (loss) per share from discontinued operations........................................................ - (0.10) (0.08) (0.01)
Basic net income (loss) per share attributable to DISH Network................................................ 2.05$ 1.77$ 1.41$ 3.40$ 2.21$
Diluted net income (loss) per share from continuing operations attributable to DISH Network........ 2.04$ 1.86$ 1.49$ 3.41$ 2.20$
Diluted net income (loss) per share from discontinued operations.................................................... - (0.10) (0.08) (0.02)
Diluted net income (loss) per share attributable to DISH Network............................................. 2.04$ 1.76$ 1.41$ 3.39$ 2.20$
Cash dividend per common share...................................................................................................... -$ -$ 1.00$ 2.00$ -$
For the Years Ended December 31,
(In thousands, except per share amounts)
Other Data (Unaudited except for net cash flows) 2014 2013 2012 2011 2010
Pay-TV subscribers, as of period end (in millions)................................................. 13.978 14.057 14.056 13.967 14.133
Pay-TV subscriber additions, gross (in millions).................................................... 2.601 2.666 2.739 2.576 3.052
Pay-TV subscriber additions, net (in millions)....................................................... (0.079) 0.001 0.089 (0.166) 0.033
Pay-TV average monthly subscriber churn rate...................................................... 1.59% 1.58% 1.57% 1.63% 1.76%
Pay-TV average subscriber acquisition cost per subscriber (“Pay-TV SAC”)........ 853$ 866$ 784$ 770$ 776$
Pay-TV average monthly revenue per subscriber (“Pay-TV ARPU”)................... 83.77$ 80.37$ 76.98$ 76.43$ 73.32$
Broadband subscribers, as of period end (in millions)............................................ 0.577 0.436 0.183 0.105 NA
Broadband subscriber additions, gross (in millions)............................................... 0.295 0.343 0.121 0.030 NA
Broadband subscriber additions, net (in millions).................................................. 0.141 0.253 0.078 (0.005) NA
Net cash flows from (in thousands):
Operating activities from continuing operations................................................ 2,408,131$ 2,309,197$ 2,003,718$ 2,619,160$ 2,139,802$
Investing activities from continuing operations................................................. (983,924)$ (3,034,857)$ (3,004,082)$ (2,783,172)$ (1,477,521)$
Financing activities from continuing operations................................................ 980,267$ 1,851,940$ 4,003,933$ 93,513$ (127,453)$
For the Years Ended December 31,
-
-