Dish Network 2014 Annual Report Download - page 130
Download and view the complete annual report
Please find page 130 of the 2014 Dish Network annual report below. You can navigate through the pages in the report by either clicking on the pages listed below, or by using the keyword search tool below to find specific information within the annual report.-
 1
1 -
2
-
3
-
4
-
5
-
6
-
7
-
8
-
9
-
10
-
11
-
12
-
13
-
14
-
15
-
16
-
17
-
18
-
19
-
20
-
21
-
22
-
23
-
24
-
25
-
26
-
27
-
28
-
29
-
30
-
31
-
32
-
33
-
34
-
35
-
36
-
37
-
38
-
39
-
40
-
41
-
42
-
43
-
44
-
45
-
46
-
47
-
48
-
49
-
50
-
51
-
52
-
53
-
54
-
55
-
56
-
57
-
58
-
59
-
60
-
61
-
62
-
63
-
64
-
65
-
66
-
67
-
68
-
69
-
70
-
71
-
72
-
73
-
74
-
75
-
76
-
77
-
78
-
79
-
80
-
81
-
82
-
83
-
84
-
85
-
86
-
87
-
88
-
89
-
90
-
91
-
92
-
93
-
94
-
95
-
96
-
97
-
98
-
99
-
100
-
101
-
102
-
103
-
104
-
105
-
106
-
107
-
108
-
109
-
110
-
111
-
112
-
113
-
114
-
115
-
116
-
117
-
118
-
119
-
 120
120 -
 121
121 -
 122
122 -
 123
123 -
 124
124 -
 125
125 -
 126
126 -
 127
127 -
 128
128 -
 129
129 -
 130
130 -
 131
131 -
 132
132 -
 133
133 -
 134
134 -
 135
135 -
 136
136 -
 137
137 -
 138
138 -
 139
139 -
 140
140 -
141
-
142
-
143
-
144
-
145
-
146
-
147
-
148
-
149
-
150
-
151
-
152
-
153
-
154
-
155
-
156
-
157
-
158
-
159
-
160
-
161
-
162
-
163
-
164
-
165
-
166
-
167
-
168
-
169
-
170
-
171
-
172
-
173
-
174
-
175
-
176
-
177
-
178
-
179
-
180
-
181
-
182
-
183
-
184
-
185
-
186
-
187
-
188
 |
 |

DISH NETWORK CORPORATION
NOTES TO CONSOLIDATED FINANCIAL STATEMENTS - Continued
F-24
securities, we evaluate, among other things, the terms of the underlying instruments, the credit ratings of the issuers,
current market conditions, and other relevant factors. Based on these factors, we assess the risk of realizing
expected cash flows and we apply an observable discount rate that reflects this risk. We may also reduce our
valuations to reflect a liquidity discount based on the lack of an active market for these securities.
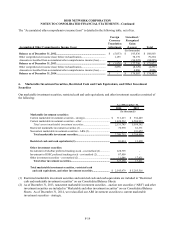
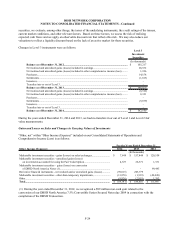
Changes in Level 3 instruments were as follows:
Level 3
Investment
Securities
(In thousands)
Balance as of December 31, 2012............................................................................................... 105,217$
Net realized and unrealized gains (losses) included in earnings................................................... 26,532
Net realized and unrealized gains (losses) included in other comprehensive income (loss)......... 1,926
Purchases...................................................................................................................................... 14,158
Settlements ................................................................................................................................... (1,813)
Issuances....................................................................................................................................... -
Transfers into or out of Level 3..................................................................................................... -
Balance as of December 31, 2013............................................................................................... 146,020$
Net realized and unrealized gains (losses) included in earnings................................................... (6,522)
Net realized and unrealized gains (losses) included in other comprehensive income (loss)......... 8,321
Purchases...................................................................................................................................... -
Settlements ................................................................................................................................... (5,679)
Issuances....................................................................................................................................... -
Transfers into or out of Level 3..................................................................................................... -
Balance as of December 31, 2014............................................................................................... 142,140$
During the years ended December 31, 2014 and 2013, we had no transfers in or out of Level 1 and Level 2 fair
value measurements.
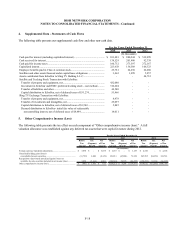
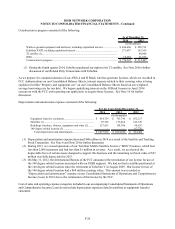
Gains and Losses on Sales and Changes in Carrying Values of Investments
“Other, net” within “Other Income (Expense)” included on our Consolidated Statements of Operations and
Comprehensive Income (Loss) is as follows:
Other Income (Expense): 2014 2013 2012
Marketable investment securities - gains (losses) on sales/exchanges........................... $ 7,649 $ 157,444 $ 120,558
Marketable investment securities - unrealized gains (losses)
on investments accounted for using the Fair Value Option....................................... 4,727 26,371 1,331
Marketable investment securities - gains (losses) on conversion
of DBSD North America Notes (1)........................................................................... - - 99,445
Derivative financial instruments - net realized and/or unrealized gains (losses)............ (59,015) 205,779 -
Marketable investment securities - other-than-temporary impairments.......................... (13,876) (1,919) (49,020)
Other.............................................................................................................................. (8,826) (2,819) 1,383
Total.............................................................................................................................. (69,341)$ 384,856$ 173,697$
For the Years Ended December 31,
(In thousands)
(1) During the year ended December 31, 2012, we recognized a $99 million non-cash gain related to the
conversion of our DBSD North America 7.5% Convertible Senior Secured Notes due 2009 in connection with the
completion of the DBSD Transaction.