Dish Network 2014 Annual Report Download - page 171
Download and view the complete annual report
Please find page 171 of the 2014 Dish Network annual report below. You can navigate through the pages in the report by either clicking on the pages listed below, or by using the keyword search tool below to find specific information within the annual report.-
 1
1 -
2
-
3
-
4
-
5
-
6
-
7
-
8
-
9
-
10
-
11
-
12
-
13
-
14
-
15
-
16
-
17
-
18
-
19
-
20
-
21
-
22
-
23
-
24
-
25
-
26
-
27
-
28
-
29
-
30
-
31
-
32
-
33
-
34
-
35
-
36
-
37
-
38
-
39
-
40
-
41
-
42
-
43
-
44
-
45
-
46
-
47
-
48
-
49
-
50
-
51
-
52
-
53
-
54
-
55
-
56
-
57
-
58
-
59
-
60
-
61
-
62
-
63
-
64
-
65
-
66
-
67
-
68
-
69
-
70
-
71
-
72
-
73
-
74
-
75
-
76
-
77
-
78
-
79
-
80
-
81
-
82
-
83
-
84
-
85
-
86
-
87
-
88
-
89
-
90
-
91
-
92
-
93
-
94
-
95
-
96
-
97
-
98
-
99
-
100
-
101
-
102
-
103
-
104
-
105
-
106
-
107
-
108
-
109
-
110
-
111
-
112
-
113
-
114
-
115
-
116
-
117
-
118
-
119
-
120
-
121
-
122
-
123
-
124
-
125
-
126
-
127
-
128
-
129
-
130
-
131
-
132
-
133
-
134
-
135
-
136
-
137
-
138
-
139
-
140
-
141
-
142
-
143
-
144
-
145
-
146
-
147
-
148
-
149
-
150
-
151
-
152
-
153
-
154
-
155
-
156
-
157
-
158
-
159
-
160
-
 161
161 -
 162
162 -
 163
163 -
 164
164 -
 165
165 -
 166
166 -
 167
167 -
 168
168 -
 169
169 -
 170
170 -
 171
171 -
 172
172 -
 173
173 -
 174
174 -
 175
175 -
 176
176 -
 177
177 -
 178
178 -
 179
179 -
 180
180 -
 181
181 -
182
-
183
-
184
-
185
-
186
-
187
-
188
 |
 |

DISH NETWORK CORPORATION
NOTES TO CONSOLIDATED FINANCIAL STATEMENTS - Continued
F-65
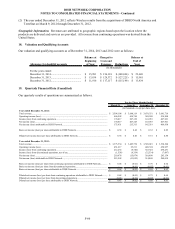
17. Segment Reporting
Operating segments are components of an enterprise for which separate financial information is available and
regularly evaluated by the chief operating decision maker(s) of an enterprise. Operating income is the primary
measure used by our chief operating decision maker to evaluate segment operating performance. We currently
operate two primary business segments, DISH and Wireless. See Note 1 for further discussion.
All other and eliminations primarily includes intersegment eliminations recorded in consolidation.
2014 2013
Total assets:
DISH.......................................................................................................... 21,424,385$ 19,694,655$
Wireless (1)................................................................................................ 7,577,894 4,625,505
Eliminations............................................................................................... (6,894,817) (4,041,934)
Total assets from continuing operations..................................................... 22,107,462 20,278,226
Assets from discontinued operations.......................................................... - 78,204
Total assets................................................................................................. 22,107,462$ 20,356,430$
All
Other & Consolidated
DISH Wireless (2) Eliminations Total
Year Ended December 31, 2014
Total revenue.............................................................................................. 14,643,049$ 410$ (72)$ 14,643,387$
Depreciation and amortization................................................................... 1,006,082 71,854 - 1,077,936
Operating income (loss) ............................................................................ 1,922,363 (97,912) - 1,824,451
Interest income........................................................................................... 376,422 15,384 (329,965) 61,841
Interest expense, net of amounts capitalized.............................................. (821,766) (119,408) 329,965 (611,209)
Other, net.................................................................................................... (9,414) (59,927) - (69,341)
Income tax (provision) benefit, net............................................................. (436,753) 159,913 - (276,840)
Income (loss) from continuing operations.................................................. 1,030,851 (101,949) - 928,902
Year Ended December 31, 2013
Total revenue.............................................................................................. 13,903,091$ 1,774$ -$ 13,904,865$
Depreciation and amortization................................................................... 952,793 101,233 - 1,054,026
Operating income (loss) ............................................................................ 1,938,998 (590,819) - 1,348,179
Interest income........................................................................................... 197,095 99,953 (148,183) 148,865
Interest expense, net of amounts capitalized.............................................. (742,207) (150,961) 148,183 (744,985)
Other, net.................................................................................................... 42,719 342,137 - 384,856
Income tax (provision) benefit, net............................................................. (511,491) 211,665 - (299,826)
Income (loss) from continuing operations.................................................. 925,114 (88,026) - 837,089
Year Ended December 31, 2012
Total revenue.............................................................................................. 13,179,907$ 1,427$ -$ 13,181,334$
Depreciation and amortization................................................................... 922,534 41,950 - 964,484
Operating income (loss)............................................................................. 1,322,474 (64,116) - 1,258,358
Interest income........................................................................................... 148,526 64,576 (114,011) 99,091
Interest expense, net of amounts capitalized.............................................. (534,585) (115,662) 114,011 (536,236)
Other, net.................................................................................................... 172,874 823 - 173,697
Income tax (provision) benefit, net............................................................. (380,758) 48,767 - (331,991)
Income (loss) from continuing operations.................................................. 728,531 (65,612) - 662,919
As of December 31,
(In thousands)
(In thousands)
(1) This increase in assets is primarily related to the acquisition of our H Block wireless spectrum licenses and the
FCC auction deposits. See Note 16 for further discussion.