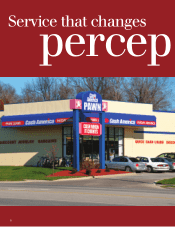
Cash America 2012 Annual Report Download - page 5
Download and view the complete annual report
Please find page 5 of the 2012 Cash America annual report below. You can navigate through the pages in the report by either clicking on the pages listed below, or by using the keyword search tool below to find specific information within the annual report.-
 1
1 -
 2
2 -
 3
3 -
 4
4 -
 5
5 -
 6
6 -
 7
7 -
 8
8 -
 9
9 -
 10
10 -
 11
11 -
 12
12 -
 13
13 -
 14
14 -
 15
15 -
 16
16 -
17
-
18
-
19
-
20
-
21
-
22
-
23
-
24
-
25
-
26
-
27
-
28
-
29
-
30
-
31
-
32
-
33
-
34
-
35
-
36
-
37
-
38
-
39
-
40
-
41
-
42
-
43
-
44
-
45
-
46
-
47
-
48
-
49
-
50
-
51
-
52
-
53
-
54
-
55
-
56
-
57
-
58
-
59
-
60
-
61
-
62
-
63
-
64
-
65
-
66
-
67
-
68
-
69
-
70
-
71
-
72
-
73
-
74
-
75
-
76
-
77
-
78
-
79
-
80
-
81
-
82
-
83
-
84
-
85
-
86
-
87
-
88
-
89
-
90
-
91
-
92
-
93
-
94
-
95
-
96
-
97
-
98
-
99
-
100
-
101
-
102
-
103
-
104
-
105
-
106
-
107
-
108
-
109
-
110
-
111
-
112
-
113
-
114
-
115
-
116
-
117
-
118
-
119
-
120
-
121
-
122
-
123
-
124
-
125
-
126
-
127
-
128
-
129
-
130
-
131
-
132
-
133
-
134
-
135
-
136
-
137
-
138
-
139
-
140
-
141
-
142
-
143
-
144
-
145
-
146
-
147
-
148
-
149
-
150
-
151
-
152
-
153
-
154
-
155
-
156
-
157
-
158
-
159
-
160
-
161
-
162
-
163
-
164
-
165
-
166
-
167
-
168
-
169
-
170
-
171
-
172
-
173
-
174
-
175
-
176
-
177
-
178
-
179
-
180
-
181
-
182
-
183
-
184
-
185
-
186
-
187
-
188
-
189
-
190
-
191
-
192
-
193
-
194
-
195
-
196
-
197
-
198
-
199
-
200
-
201
-
202
-
203
-
204
-
205
-
206
-
207
-
208
 |
 |

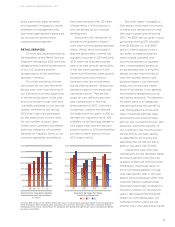
$1.50
$1.25
$1.00
$0.75
$0.50
$0.25
$0.0
Quarterly Earnings Per Share
Continuing Operations
Q4*Q1
10 11 12
Q2 Q3*
CASH A M E RICA INTER N A T I ONAL, INC .
most signicant dollar amounts
and represent missteps by certain
members of management who
have been appropriately penalized
by our pay-for-performance
compensation programs.
RETAIL SERVICES
The two key issues dominating
the headlines of the Retail Services
Segment throughout 2012 were the
disappointing nancial performance
of our U.S. business and the
reorganization of the storefront
business in Mexico.
The more troubling of these
two issues for me was the rather
abrupt year-over-year slowing of
our Domestic business, beginning
in the second quarter of the year
and continuing through year-end.
I candidly admitted on our second-
quarter conference call during
2012 that I was a bit perplexed
by the steep drop in trend rates
for the number of pawn loans
written and customers’ purchases –
both key indicators of customer
demand for liquidity. Some of our
investors appeared unsettled to
hear that someone with 30 years
of experience in this business is
ever perplexed by any unusual
development.
Now even with the benet of
several more quarters of data, I
can’t claim to have gained absolute
clarity. What I have concluded is
that the abnormality in trend line
arguably occurred in 2011 and early
2012, when we enjoyed outsized
year-over-year growth, particularly
in the last three quarters of 2011.
Same-store Domestic asset growth
for pawn loans and inventory
hovered in the low to mid-teens
during those quarters – producing
impressive gains in revenues and
operating income. That set the
stage for very difcult year-over-
year comparisons in the nal
three quarters of 2012. Like many
companies, I believe we allowed
the euphoria of our gains in 2011 to
dampen our inquisitive spirit. We
probably could have dug deeper to
fully grasp what was driving such
positive results in 2011 and therefore
provide a clearer picture of how
2012 might unfold.
But even today, I struggle to
fully explain what macro-economic
or behavioral trends were driving
the surge in asset growth during
2011. The $500 per oz. spike in spot
gold prices during 2011 (roughly
from $1,400 per oz. to $1,900
per oz.) clearly played a role in
our ability to expand advance
rates on gold collateral, and
spurred consumers to liquidate
their unwanted gold jewelry at
an accelerated rate. During this
period, we saw record levels of
over-the-counter jewelry and
gold purchases in our domestic
shops, but we also saw higher
levels of purchases in our general
merchandise categories such as
electronics and tools. The demand
for pawn loans in all categories
was strong during this period as
well. Rising gasoline prices and
static household earnings likely
spurred the loan and purchase
activity, but counterintuitively I also
sense the “economic psyche” of
our customers was more buoyant
during 2011, as we were seeing
an appetite for borrowing and
spending that we did not see in
2010 or the latter half of 2012.
I expect the year-over-year
comparisons for the domestic Retail
Services Segment in the rst two
quarters of 2013 will continue to be
challenging. We should return to
more normalized patterns of year-
over-year growth later in the year,
absent some unforeseen shift in the
customer behavior patterns that
have been reasonably consistent in
the pawn industry for the past 30
years. I also expect that the prot
margin on commercial sales will
compress further unless we see
another rise in the spot price of gold.
3
*Includes $39 million pre-tax ($36.2 million after tax) in unusual items expensed related to the reorganization
of the Company’s Mexico-based pawn operations, the voluntary refund to certain Ohio customers and the
withdrawal of the Enova International, Inc. proposed IPO during 2012 ($0.65 per share in Q3 2012 and $0.50
per share in Q4 2012).
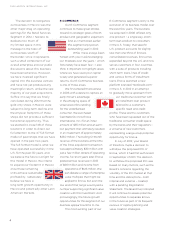
$350
$300
$250
$200
$150
$100
$50
$0
Income from Operations Before
Depreciation and Amortization
(in millions)
10 11 12*08 09