Cash America 2012 Annual Report Download - page 3
Download and view the complete annual report
Please find page 3 of the 2012 Cash America annual report below. You can navigate through the pages in the report by either clicking on the pages listed below, or by using the keyword search tool below to find specific information within the annual report.-
 1
1 -
 2
2 -
 3
3 -
 4
4 -
 5
5 -
 6
6 -
 7
7 -
 8
8 -
 9
9 -
 10
10 -
 11
11 -
 12
12 -
 13
13 -
 14
14 -
15
-
16
-
17
-
18
-
19
-
20
-
21
-
22
-
23
-
24
-
25
-
26
-
27
-
28
-
29
-
30
-
31
-
32
-
33
-
34
-
35
-
36
-
37
-
38
-
39
-
40
-
41
-
42
-
43
-
44
-
45
-
46
-
47
-
48
-
49
-
50
-
51
-
52
-
53
-
54
-
55
-
56
-
57
-
58
-
59
-
60
-
61
-
62
-
63
-
64
-
65
-
66
-
67
-
68
-
69
-
70
-
71
-
72
-
73
-
74
-
75
-
76
-
77
-
78
-
79
-
80
-
81
-
82
-
83
-
84
-
85
-
86
-
87
-
88
-
89
-
90
-
91
-
92
-
93
-
94
-
95
-
96
-
97
-
98
-
99
-
100
-
101
-
102
-
103
-
104
-
105
-
106
-
107
-
108
-
109
-
110
-
111
-
112
-
113
-
114
-
115
-
116
-
117
-
118
-
119
-
120
-
121
-
122
-
123
-
124
-
125
-
126
-
127
-
128
-
129
-
130
-
131
-
132
-
133
-
134
-
135
-
136
-
137
-
138
-
139
-
140
-
141
-
142
-
143
-
144
-
145
-
146
-
147
-
148
-
149
-
150
-
151
-
152
-
153
-
154
-
155
-
156
-
157
-
158
-
159
-
160
-
161
-
162
-
163
-
164
-
165
-
166
-
167
-
168
-
169
-
170
-
171
-
172
-
173
-
174
-
175
-
176
-
177
-
178
-
179
-
180
-
181
-
182
-
183
-
184
-
185
-
186
-
187
-
188
-
189
-
190
-
191
-
192
-
193
-
194
-
195
-
196
-
197
-
198
-
199
-
200
-
201
-
202
-
203
-
204
-
205
-
206
-
207
-
208
 |
 |

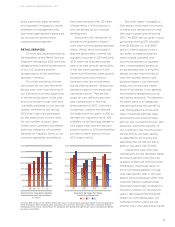
FINANCIAL HIGHLIGHTS
CASH A M E RICA INTER N A T I ONAL, INC .
$2.0
$1.8
$1.6
$1.4
$1.2
$1.0
$0.8
$0.6
$0.4
$0.2
$0
Total Revenue
(in billions)
10 11 1208 09
$4.5
$4.0
$3.5
$3.0
$2.5
$2.0
$1.5
$1.0
$0.5
$0.0
Total Loans Written
to Consumers*
(in billions)
10 11 1208 09
(Dollars in thousands, except share data) 2012 2011 2010
OPERATIONS – years ended December 31
Total revenue $ 1,800,430 $ 1,583,064 $ 1,337,050
Income from operations before
depreciation and amortization 291,343 298,491 251,055
Income from operations 215,915 244,342 207,132
Net income attributable to
Cash America International, Inc. $ 107,470 $ 135,963 $ 115,538
Net income per share – Diluted $ 3.42 $ 4.25 $ 3.67
Dividends per share $ 0.14 $ 0.14 $ 0.14
BALANCE SHEETS – at December 31
Earning assets $ 701,467 $ 638,181 $ 487,735
Total assets 1,818,258 1,674,249 1,427,186
Total debt 578,330 537,291 456,704
Total equity 990,620 907,590 802,731
Current ratio 4.8x 4.8x 4.8x
Debt to equity ratio 58.4% 59.2% 56.9%
Return on assets (a) 6.0% 8.9% 8.8%
Return on equity (a) 11.1% 15.9% 15.6%
Net book value per common share outstanding $ 34.26 $ 31.02 $ 27.14
Common shares outstanding (b) 28,914,874 29,256,333 29,582,290
(a) Returns based on Net Income for the 12-month period divided by the monthly average of total assets and the monthly average of total equity of the Company.
(b) Includes 31,403 shares, 32,506 shares and 32,421 shares in 2012, 2011 and 2010, respectively, held in the Company’s nonqualied deferred compensation plan.
1
*Includes loans funded by third
parties that are guaranteed by
the Company
$2.0
$1.8
$1.6
$1.4
$1.2
$1.0
$0.8
$0.6
$0.4
$0.2
$0
Total Assets
(in billions)
10 11 1208 09