Carphone Warehouse 2007 Annual Report Download - page 19
Download and view the complete annual report
Please find page 19 of the 2007 Carphone Warehouse annual report below. You can navigate through the pages in the report by either clicking on the pages listed below, or by using the keyword search tool below to find specific information within the annual report.-
 1
1 -
2
-
3
-
4
-
5
-
6
-
7
-
8
-
 9
9 -
 10
10 -
 11
11 -
 12
12 -
 13
13 -
 14
14 -
 15
15 -
 16
16 -
 17
17 -
 18
18 -
 19
19 -
 20
20 -
 21
21 -
 22
22 -
 23
23 -
 24
24 -
 25
25 -
 26
26 -
 27
27 -
 28
28 -
 29
29 -
30
-
31
-
32
-
33
-
34
-
35
-
36
-
37
-
38
-
39
-
40
-
41
-
42
-
43
-
44
-
45
-
46
-
47
-
48
-
49
-
50
-
51
-
52
-
53
-
54
-
55
-
56
-
57
-
58
-
59
-
60
-
61
-
62
-
63
-
64
-
65
-
66
-
67
-
68
-
69
-
70
-
71
-
72
-
73
-
74
-
75
-
76
-
77
-
78
-
79
-
80
 |
 |

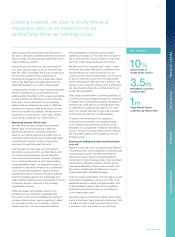
Cash flow and dividend
At 31 March 2007, the Group had net debt of £616.9m
(2006: £273.4m). During the year the Group generated
cash from operations of £256.3m (2006: £196.4m).
Cash generation remains a prime objective of the
Group and we expect to continue to generate
significant levels of free cash flow in the future,
allowing us to re-invest in the growth of the business
and pursue a progressive dividend policy. We are
proposing a final dividend of 2.25p per share, taking
the total dividend for the financial year to 3.25p and
representing growth of 30% over last year’s 2.50p
total dividend. This level of distribution results in a
dividend cover of 2.33 (2006: 3.24). The ex-dividend
date is Wednesday 4 July 2007, with a record date
of Friday 6 July 2007 and an intended payment date
of Friday 3 August 2007.
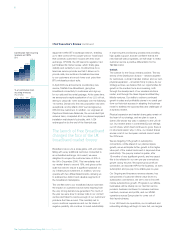
Summary cash flows
2007 2006
£m £m
Operating cash flow 256.3 196.4
Tax and interest (32.9) (19.4)
Net operating cash flow 223.4 177.0
Property, plant and
equipment (net) (147.8) (86.9)
Intangibles (148.1) (104.7)
Acquisitions/JVs (266.7) (159.5)
Total investment (562.6) (351.1)
Dividends (24.2) (17.4)
Shares 9.1 (5.1)
Net dividends and shares (15.1) (22.5)
Net cash outflow (354.3) (196.6)
Opening net debt* (273.4) (66.5)
Foreign exchange and
non-cash movements 10.8 (10.3)
Closing net debt (616.9) (273.4)
* After restatement for IAS32 and IAS39 in
the prior period
Total investment increased from £351.1m to £562.6m
year-on-year. In addition to the acquisitions noted
above, the increase reflects an uplift in subscriber
acquisition costs from £51.6m to £71.8m, and a
substantial increase in investment in the Group’s IT
systems and network infrastructure.
Balance sheet
The investment described above resulted in an
increase in non-current assets from £1,014.9m
to £1,557.5m year-on-year.
customers require on-site and remote consultancy
to enhance their user experience.
In the year to March 2007, losses from joint ventures
amounted to £9.9m, with the majority relating to our
Virgin Mobile venture. As previously indicated, we
anticipate total losses of £15-20m in the coming year,
as Virgin Mobile continues to invest in building its
brand and customer base and the Best Buy ventures
move towards critical mass.
Acquisitions
During the year the Group’s principal acquisition
was the UK internet access business of AOL, for
a gross cash consideration of £251.5m and deferred
consideration of £128.4m, payable over 18 months.
Acquisition intangibles of £323.6m and goodwill
of £75.9m arose on the purchase.
Acquisition intangibles relate principally to customer
bases, together with contingent rights to a share
of future customer transactional spend and a licence
to continue to use the AOL brand.
We have not yet commenced the restructuring
of the AOL business, but expect to do so in the
forthcoming year.
Amortisation of acquisition intangibles and
goodwill expense
The amortisation charge in respect of acquisition
intangibles amounted to £54.2m (2006: £18.0m), the
increase reflecting the full year impact of the Onetel
acquisition, and the AOL acquisition intangibles noted
above. A goodwill expense of £0.5m (2006: £1.8m)
has been recognised in respect of historical
acquisitions. These figures are excluded from Headline
profit before taxation and earnings per share figures.
Interest and tax
Net interest of £26.4m was payable during the year,
compared to a charge of £5.7m in the prior year.
Significant investment in capital expenditure and
acquisitions were financed out of operating cash
flow and debt facilities.
The effective tax rate on a Headline basis was
14.3% (2006: 19.6%). The tax rate benefited from
the recognition of tax losses incurred in earlier
years, losses acquired from earlier acquisitions
and low tax rate jurisdictions.
Earnings per share (“EPS”)
Headline EPS was 11.82p (2006: 12.38p).
Statutory EPS was 7.51p (2006: 7.99p).
15
Business Review Governance Financial Statements
www.cpwplc.com