Carphone Warehouse 2007 Annual Report Download - page 14
Download and view the complete annual report
Please find page 14 of the 2007 Carphone Warehouse annual report below. You can navigate through the pages in the report by either clicking on the pages listed below, or by using the keyword search tool below to find specific information within the annual report.-
 1
1 -
2
-
3
-
 4
4 -
 5
5 -
 6
6 -
 7
7 -
 8
8 -
 9
9 -
 10
10 -
 11
11 -
 12
12 -
 13
13 -
 14
14 -
 15
15 -
 16
16 -
 17
17 -
 18
18 -
 19
19 -
 20
20 -
 21
21 -
 22
22 -
 23
23 -
 24
24 -
25
-
26
-
27
-
28
-
29
-
30
-
31
-
32
-
33
-
34
-
35
-
36
-
37
-
38
-
39
-
40
-
41
-
42
-
43
-
44
-
45
-
46
-
47
-
48
-
49
-
50
-
51
-
52
-
53
-
54
-
55
-
56
-
57
-
58
-
59
-
60
-
61
-
62
-
63
-
64
-
65
-
66
-
67
-
68
-
69
-
70
-
71
-
72
-
73
-
74
-
75
-
76
-
77
-
78
-
79
-
80
 |
 |

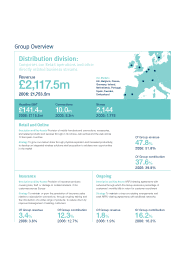
Business Review
Distribution Division
The Distribution division comprises our Retail
operations and all directly-related business streams.
The key operating assets of the division are our
2,144 stores across 10 European countries and
our Retail and Online brands. Equally important
are our supplier and partner relationships.
Distribution revenues were up 20.8% year-on-year to
£2,117.5m, and the division generated Headline EBIT
of £141.4m, a rise of 22.4%. Growth was strong
across all revenue lines.
From next year the Distribution division will also
incorporate our Mobile operations, as well as our
Dealer and non-UK Fixed Line business operations.
This will more accurately group our future operations
by the key assets that support them.
Retail (including Online)
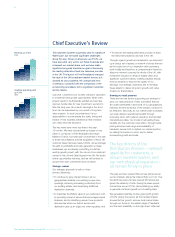
The Group achieved 10.0m connections during the
year, representing growth of 22.3% over the prior year.
Subscription connections, the key driver of value in
our Distribution business, were up 17.3% to 4.0m.
We continued to operate in an attractive market, with
fashion and technology being the main drivers of an
accelerating handset replacement cycle, and network
operators keen to pursue customer growth.
We executed well on our handset strategy, focusing
on the broadest range and the best availability in
the market, with a number of exclusive products
to stimulate demand and raise footfall. In addition,
we began work on improving retail productivity,
as we seek ways to convert more of our footfall
into revenues. This will be a key operational goal
for the coming year.
Pre-pay sales continued the very strong trend from the
previous year, with total connections up 27.7%. This
performance partly reflects a buoyant market for
pre-pay, and partly our successful strategy of growing
our pre-pay market share towards the level of our
subscription share. Towards the end of the financial
year, pre-pay growth slowed as the market became
more subdued and we came up against very strong
comparable growth figures. SIM-free sales were up
10.7% year-on-year.
Connections
2007 2006
000s 000s
Subscription 4,016 3,423
Pre-pay 5,428 4,252
SIM-free 571 516
Total 10,014 8,191
We opened 444 new stores during the year and
closed 78. The total number of stores increased
from 1,778 at March 2006 to 2,144 by March 2007.
The total includes 194 franchise stores (2006: 140
franchises). Total average selling space excluding
franchises increased by 16.5% to 96,865 sqm
(2006: 83,128 sqm) and sales per square metre
increased by 4.1% to £17,219 (2006: £16,547). Total
average selling space including franchises increased
by 18.9% to 104,452 sqm (2006: 87,871 sqm).
Total Retail revenues (including Online) were up 20.9%
and gross profit by 23.9%. Like-for-like revenue
growth was 6.6% and like-for-like gross profit growth
was 5.0%. The increase in revenues was the result
of strong connections growth, partially offset by a fall
in average revenue per connection from £192.8 to
£190.6 as a result of the higher proportion of pre-pay
sales within the mix.
Average cash gross profit per connection rose from
£54.4 to £55.2. Gross profit per connection on
subscription rose 4.4% to £98.5 and gross profit
per connection on pre-pay rose 1.6% to £26.2.
Operating and Financial Performance
The Carphone Warehouse Group PLC Annual Report 2007
10
52 week Subscription
connections up 17.3%
(000s)
2,413
2,770
3,423
4,016
04 05 06 07
52 week Total connections
up 22.3%
(000s)
5,350
6,503
8,191
10,014
04 05 06 07
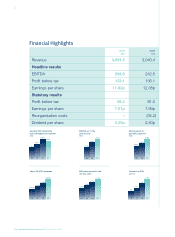
2007 2006
Headline Financials £m £m
Revenue 2,117.5 1,753.5
Retail (inc Online) 1,908.8 1,579.0
Insurance 137.0 116.1
Ongoing 71.7 58.4
Contribution 292.8 246.1
Retail (inc Online) 166.6 142.2
Insurance 54.5 45.5
Ongoing 71.7 58.4
Support costs (96.6) (84.1)
EBITDA 196.2 162.0
Depreciation and amortisation (54.8) (46.5)
EBIT 141.4 115.5
EBIT % 6.7% 6.6%