Canon 2010 Annual Report Download - page 2
Download and view the complete annual report
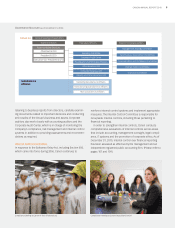
Please find page 2 of the 2010 Canon annual report below. You can navigate through the pages in the report by either clicking on the pages listed below, or by using the keyword search tool below to find specific information within the annual report.-
 1
1 -
 2
2 -
 3
3 -
 4
4 -
 5
5 -
 6
6 -
 7
7 -
 8
8 -
 9
9 -
 10
10 -
 11
11 -
 12
12 -
 13
13 -
14
-
15
-
16
-
17
-
18
-
19
-
20
-
21
-
22
-
23
-
24
-
25
-
26
-
27
-
28
-
29
-
30
-
31
-
32
-
33
-
34
-
35
-
36
-
37
-
38
-
39
-
40
-
41
-
42
-
43
-
44
-
45
-
46
-
47
-
48
-
49
-
50
-
51
-
52
-
53
-
54
-
55
-
56
-
57
-
58
-
59
-
60
-
61
-
62
-
63
-
64
-
65
-
66
-
67
-
68
-
69
-
70
-
71
-
72
-
73
-
74
-
75
-
76
-
77
-
78
-
79
-
80
-
81
-
82
-
83
-
84
-
85
-
86
-
87
-
88
-
89
-
90
-
91
-
92
-
93
-
94
-
95
-
96
-
97
-
98
-
99
-
100
-
101
-
102
-
103
-
104
-
105
-
106
-
107
-
108
-
109
-
110
-
111
-
112
-
113
-
114
 |
 |

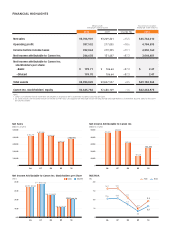
Millions of yen
(except per share amounts) Thousands of U.S. dollars
(except per share amounts)
2010 2009 Change (%) 2010
Net sales ¥3,706,901 ¥3,209,201 +15.5 $45,764,210
Operating profi t 387,552 217,055 +78.6 4,784,593
Income before income taxes 392,863 219,355 +79.1 4,850,160
Net income attributable to Canon Inc. 246,603 131,647 +87.3 3,044,481
Net income attributable to Canon Inc.
stockholders per share:
–Basic ¥ 199.71 ¥ 106.64 +87.3 $ 2.47
–Diluted 199.70 106.64 +87.3 2.47
Total assets ¥3,983,820 ¥3,847,557 +3.5 $49,182,963
Canon Inc. stockholders’ equity ¥2,645,782 ¥2,688,109 -1.6 $32,663,975
Notes:
1. Canon’s consolidated fi nancial statements are prepared in accordance with U.S. generally accepted accounting principles.
2. U.S. dollar amounts are translated from yen at the rate of JPY81=U.S.$1, the approximate exchange rate on the Tokyo Foreign Exchange Market as of December 30, 2010, solely for the conve-
nience of the reader.
3,000,000
4,000,000
1,000,000
2,000,000
5,000,000
080706 09 10
0
Net Sales
(Millions of yen)
0
0.00 0
3,209,201
4,156,759
4,481,346
4,094,161
400,000
300,000
100,000
200,000
500,000
080706 09 10
Net Income Attributable to Canon Inc.
(Millions of yen)
131,647
455,325
488,332
309,148
200.00
100.00
400.00
300.00
080706 09 10
Net Income Attributable to Canon Inc. Stockholders per Share
(Yen)
106.64
341.95
377.59
246.21
106.64
341.84
377.53
246.20
10.0
15.0
5.0
20.0
080706 09 10
ROE/ROA
(%)
4.9
3.4
16.3 16.5
10.6 10.8 11.1
7.3
ROE ROABasic Diluted
3,706,901
246,603
199.71199.70 9.2
6.3
FINANCIAL HIGHLIGHTS