Cablevision 2011 Annual Report Download - page 78
Download and view the complete annual report
Please find page 78 of the 2011 Cablevision annual report below. You can navigate through the pages in the report by either clicking on the pages listed below, or by using the keyword search tool below to find specific information within the annual report.-
 1
1 -
2
-
3
-
4
-
5
-
6
-
7
-
8
-
9
-
10
-
11
-
12
-
13
-
14
-
15
-
16
-
17
-
18
-
19
-
20
-
21
-
22
-
23
-
24
-
25
-
26
-
27
-
28
-
29
-
30
-
31
-
32
-
33
-
34
-
35
-
36
-
37
-
38
-
39
-
40
-
41
-
42
-
43
-
44
-
45
-
46
-
47
-
48
-
49
-
50
-
51
-
52
-
53
-
54
-
55
-
56
-
57
-
58
-
59
-
60
-
61
-
62
-
63
-
64
-
65
-
66
-
67
-
 68
68 -
 69
69 -
 70
70 -
 71
71 -
 72
72 -
 73
73 -
 74
74 -
 75
75 -
 76
76 -
 77
77 -
 78
78 -
 79
79 -
 80
80 -
 81
81 -
 82
82 -
 83
83 -
 84
84 -
 85
85 -
 86
86 -
 87
87 -
 88
88 -
89
-
90
-
91
-
92
-
93
-
94
-
95
-
96
-
97
-
98
-
99
-
100
-
101
-
102
-
103
-
104
-
105
-
106
-
107
-
108
-
109
-
110
-
111
-
112
-
113
-
114
-
115
-
116
-
117
-
118
-
119
-
120
-
121
-
122
-
123
-
124
-
125
-
126
-
127
-
128
-
129
-
130
-
131
-
132
-
133
-
134
-
135
-
136
-
137
-
138
-
139
-
140
-
141
-
142
-
143
-
144
-
145
-
146
-
147
-
148
-
149
-
150
-
151
-
152
-
153
-
154
-
155
-
156
-
157
-
158
-
159
-
160
-
161
-
162
-
163
-
164
-
165
-
166
-
167
-
168
-
169
-
170
-
171
-
172
-
173
-
174
-
175
-
176
-
177
-
178
-
179
-
180
-
181
-
182
-
183
-
184
-
185
-
186
-
187
-
188
-
189
-
190
-
191
-
192
-
193
-
194
-
195
-
196
-
197
-
198
-
199
-
200
-
201
-
202
-
203
-
204
-
205
-
206
-
207
-
208
-
209
-
210
-
211
-
212
-
213
-
214
-
215
-
216
-
217
-
218
-
219
-
220
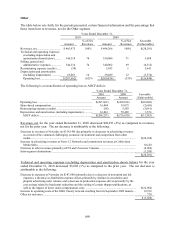
 |
 |
(72)
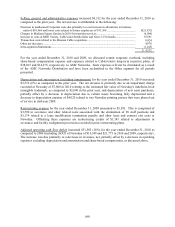
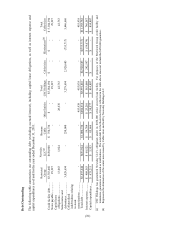
Net cash used in financing activities amounted to $670,478 for the year ended December 31, 2009 and
consisted primarily of the repayment and repurchase of senior notes of $2,398,740, net repayments of
credit facility debt of $235,000, dividend payments to common stockholders of $123,499, additions to
deferred financing costs of $49,775 and other net cash payments of $1,748, partially offset by proceeds of
$2,138,284 from the issuance of senior notes.
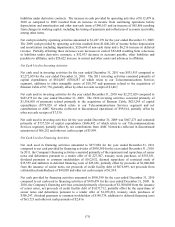
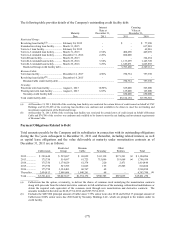
Continuing Operations - CSC Holdings, LLC
Net Cash Provided by Operating Activities
Net cash provided by operating activities amounted to $1,615,717 for the year ended December 31, 2011
compared to $1,608,007 for the year ended December 31, 2010. The 2011 cash provided by operating
activities resulted from $1,388,052 of income before depreciation and amortization (including
impairments), $438,772 of non-cash items and a $9,500 increase in deferred revenue. Partially offsetting
these increases were decreases in cash of $111,895 resulting from a decrease in liabilities under derivative
contracts, $53,599 resulting from an increase in current and other assets and advances to affiliates and
$55,113 from a decrease in accounts payable, other liabilities and amounts due to affiliates. The increase
in cash provided by operating activities of $7,710 in 2011 as compared to 2010 resulted from an increase
in income from continuing operations before depreciation and amortization and other non-cash items of
$190,378, partially offset by a decrease of $182,668 resulting from changes in working capital, including
the timing of payments and collections of accounts receivable, among other items.
Net cash provided by operating activities amounted to $1,608,007 for the year ended December 31, 2010
compared to $1,397,075 for the year ended December 31, 2009. The 2010 cash provided by operating
activities resulted from $1,308,170 of income before depreciation and amortization (including
impairments), $328,276 of non-cash items and a $75,236 increase in accounts payable, other liabilities
and amounts due to affiliates. Partially offsetting these increases were decreases in cash of $59,492
resulting from an increase in current and other assets and advances to affiliates and a $44,183 decrease in
liabilities under derivative contracts. The increase in cash provided by operating activities of $210,932 in
2010 as compared to 2009 resulted from an increase in income from continuing operations before
depreciation and amortization and other non-cash items of $108,710 and an increase of $102,222 resulting
from changes in working capital, including the timing of payments and collections of accounts receivable,
among other items.
Net cash provided by operating activities amounted to $1,397,075 for the year ended December 31, 2009.
The 2009 cash provided by operating activities resulted from $1,145,891 of income before depreciation
and amortization (including impairments), $381,845 of non-cash items and a $6,216 increase in deferred
revenue. Partially offsetting these increases were decreases in cash of $67,991 resulting from a decrease
in accounts payable, other liabilities and amounts due to affiliates, a $52,408 decrease in liabilities under
derivative contracts, and a $16,478 increase in current and other assets and advances to affiliates.
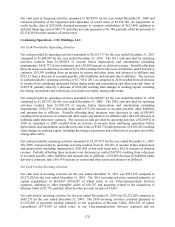
Net Cash Used in Investing Activities
Net cash used in investing activities for the year ended December 31, 2011 was $831,913 compared to
$2,272,029 for the year ended December 31, 2010. The 2011 investing activities consisted primarily of
capital expenditures of $814,807 ($760,287 of which relate to our Telecommunications Services
segment), additions to other intangible assets of $10,797 and payments related to the acquisition of
Bresnan Cable of $7,776, partially offset by other net cash receipts of $1,467.
Net cash used in investing activities for the year ended December 31, 2010 was $2,272,029 compared to
$667,273 for the year ended December 31, 2009. The 2010 investing activities consisted primarily of
$1,356,500 of payments relating primarily to the acquisition of Bresnan Cable, $823,245 of capital
expenditures ($779,928 of which relate to our Telecommunications Services segment) and net