Cablevision 2011 Annual Report Download - page 53
Download and view the complete annual report
Please find page 53 of the 2011 Cablevision annual report below. You can navigate through the pages in the report by either clicking on the pages listed below, or by using the keyword search tool below to find specific information within the annual report.-
 1
1 -
2
-
3
-
4
-
5
-
6
-
7
-
8
-
9
-
10
-
11
-
12
-
13
-
14
-
15
-
16
-
17
-
18
-
19
-
20
-
21
-
22
-
23
-
24
-
25
-
26
-
27
-
28
-
29
-
30
-
31
-
32
-
33
-
34
-
35
-
36
-
37
-
38
-
39
-
40
-
41
-
42
-
 43
43 -
 44
44 -
 45
45 -
 46
46 -
 47
47 -
 48
48 -
 49
49 -
 50
50 -
 51
51 -
 52
52 -
 53
53 -
 54
54 -
 55
55 -
 56
56 -
 57
57 -
 58
58 -
 59
59 -
 60
60 -
 61
61 -
 62
62 -
 63
63 -
64
-
65
-
66
-
67
-
68
-
69
-
70
-
71
-
72
-
73
-
74
-
75
-
76
-
77
-
78
-
79
-
80
-
81
-
82
-
83
-
84
-
85
-
86
-
87
-
88
-
89
-
90
-
91
-
92
-
93
-
94
-
95
-
96
-
97
-
98
-
99
-
100
-
101
-
102
-
103
-
104
-
105
-
106
-
107
-
108
-
109
-
110
-
111
-
112
-
113
-
114
-
115
-
116
-
117
-
118
-
119
-
120
-
121
-
122
-
123
-
124
-
125
-
126
-
127
-
128
-
129
-
130
-
131
-
132
-
133
-
134
-
135
-
136
-
137
-
138
-
139
-
140
-
141
-
142
-
143
-
144
-
145
-
146
-
147
-
148
-
149
-
150
-
151
-
152
-
153
-
154
-
155
-
156
-
157
-
158
-
159
-
160
-
161
-
162
-
163
-
164
-
165
-
166
-
167
-
168
-
169
-
170
-
171
-
172
-
173
-
174
-
175
-
176
-
177
-
178
-
179
-
180
-
181
-
182
-
183
-
184
-
185
-
186
-
187
-
188
-
189
-
190
-
191
-
192
-
193
-
194
-
195
-
196
-
197
-
198
-
199
-
200
-
201
-
202
-
203
-
204
-
205
-
206
-
207
-
208
-
209
-
210
-
211
-
212
-
213
-
214
-
215
-
216
-
217
-
218
-
219
-
220
 |
 |
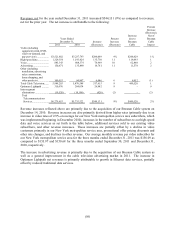
(47)
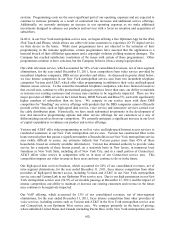
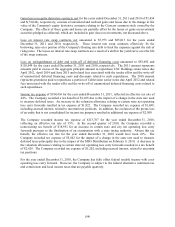
participant may generate, the amount and timing of expected future cash flows, including expected cash
flows beyond the Company's current long-term business planning period, and certain tax benefits the
Company would recognize. The discount rate utilized for the interim impairment assessment was a
consolidated weighted average discount rate of 12.5% at December 31, 2011 and 12% at December 31,
2010 and 2009. The market approach measures fair value using market multiples of various financial
measures compared to a set of comparable publicly traded newspaper publishing companies and
comparable transactions taking into consideration potential synergies a market participant may generate
and requires significant judgments in determining comparable market multiples. The weighting between
the income approach and market approach was weighted more towards the income approach based on our
belief that the income approach was more reliable in the midst of the steep economic decline impacting
the publishing industry, and in view of the fact that there were no recent observable sales transactions
involving the newspaper business. The estimated fair values of Newsday's indefinite-lived intangibles,
which relate primarily to the trademarks associated with its newspaper mastheads, were based on
discounted future cash flows calculated based on the relief-from-royalty method. Changes in such
estimates or the application of alternative assumptions could produce significantly different results.
The reduction in estimated fair values of the trademarks under the relief-from-royalty method was
primarily due to an increase in the discount rate for the Newsday print newspaper from 11.5% in 2009 to
12.0% in 2010 and 12.5% in 2011, and a decline in the Company's revenue projections for the Newsday
print newspaper and newsday.com in comparison to the revenue projections originally used when
Newsday was acquired in July 2008. The primary reason for the increase in the discount rate for the
Newsday print newspaper trademark from 11.5% in 2009 to 12.5% in 2011 was due to an increase in both
the estimated cost of equity and debt for the industry, which was primarily due to an increase in the
economic volatility affecting the overall economy, and in particular the newspaper publishing industry,
and an increase in borrowing costs to the industry. The assumed royalty rate remained at 3% for 2009,
2010 and 2011, although this was a decline from the 4% that was originally used when Newsday was
acquired. The decrease from 4% to 3% was due to the lower projected margins for the Newsday print
newspaper and newsday.com.
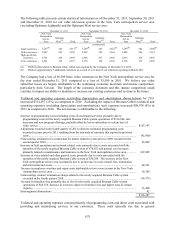
Valuation of Deferred Tax Assets:
Deferred tax assets have resulted primarily from the Company's future deductible temporary differences
and net operating loss carry forwards ("NOLs"). In assessing the realizability of deferred tax assets,
management considers whether it is more likely than not that some portion or all of the deferred tax asset
will not be realized. The Company's ability to realize its deferred tax assets depends upon the generation
of sufficient future taxable income and tax planning strategies to allow for the utilization of its NOLs and
deductible temporary differences. If such estimates and related assumptions change in the future, the
Company may be required to record additional valuation allowances against its deferred tax assets,
resulting in additional income tax expense in the Company's consolidated statement of income.
Management evaluates the realizability of the deferred tax assets and the need for additional valuation
allowances quarterly. At this time, based on current facts and circumstances, management believes that it
is more likely than not that the Company will realize benefit for its gross deferred tax assets, except those
deferred tax assets against which a valuation allowance has been recorded which relate to certain state
NOLs. The Company increased the valuation allowance by $1,822 in 2011, decreased the valuation
allowance by $2,428 in 2010 and decreased the valuation allowance by $1,427 in 2009. In connection
with the AMC Networks Distribution, a reduction in the valuation allowance of $491 was recorded as an
increase in additional paid-in capital. During 2011, 2010 and 2009, certain state NOLs expired prior to
utilization. The deferred tax asset corresponding to the expired NOLs had been fully offset by a valuation
allowance. The associated deferred tax asset and valuation allowance were both reduced by $425, $287
and $3,609 in 2011, 2010 and 2009, respectively. To address state income tax planning considerations,
certain subsidiary corporations were converted to limited liability companies during 2009. Certain state
NOLs, for which the related deferred tax assets were fully offset by a valuation allowance, were
eliminated pursuant to such conversions. Accordingly, the associated deferred tax asset and valuation
allowance were both reduced by $9,355 in 2009.