Cablevision 2011 Annual Report Download - page 61
Download and view the complete annual report
Please find page 61 of the 2011 Cablevision annual report below. You can navigate through the pages in the report by either clicking on the pages listed below, or by using the keyword search tool below to find specific information within the annual report.-
 1
1 -
2
-
3
-
4
-
5
-
6
-
7
-
8
-
9
-
10
-
11
-
12
-
13
-
14
-
15
-
16
-
17
-
18
-
19
-
20
-
21
-
22
-
23
-
24
-
25
-
26
-
27
-
28
-
29
-
30
-
31
-
32
-
33
-
34
-
35
-
36
-
37
-
38
-
39
-
40
-
41
-
42
-
43
-
44
-
45
-
46
-
47
-
48
-
49
-
50
-
 51
51 -
 52
52 -
 53
53 -
 54
54 -
 55
55 -
 56
56 -
 57
57 -
 58
58 -
 59
59 -
 60
60 -
 61
61 -
 62
62 -
 63
63 -
 64
64 -
 65
65 -
 66
66 -
 67
67 -
 68
68 -
 69
69 -
 70
70 -
 71
71 -
72
-
73
-
74
-
75
-
76
-
77
-
78
-
79
-
80
-
81
-
82
-
83
-
84
-
85
-
86
-
87
-
88
-
89
-
90
-
91
-
92
-
93
-
94
-
95
-
96
-
97
-
98
-
99
-
100
-
101
-
102
-
103
-
104
-
105
-
106
-
107
-
108
-
109
-
110
-
111
-
112
-
113
-
114
-
115
-
116
-
117
-
118
-
119
-
120
-
121
-
122
-
123
-
124
-
125
-
126
-
127
-
128
-
129
-
130
-
131
-
132
-
133
-
134
-
135
-
136
-
137
-
138
-
139
-
140
-
141
-
142
-
143
-
144
-
145
-
146
-
147
-
148
-
149
-
150
-
151
-
152
-
153
-
154
-
155
-
156
-
157
-
158
-
159
-
160
-
161
-
162
-
163
-
164
-
165
-
166
-
167
-
168
-
169
-
170
-
171
-
172
-
173
-
174
-
175
-
176
-
177
-
178
-
179
-
180
-
181
-
182
-
183
-
184
-
185
-
186
-
187
-
188
-
189
-
190
-
191
-
192
-
193
-
194
-
195
-
196
-
197
-
198
-
199
-
200
-
201
-
202
-
203
-
204
-
205
-
206
-
207
-
208
-
209
-
210
-
211
-
212
-
213
-
214
-
215
-
216
-
217
-
218
-
219
-
220
 |
 |

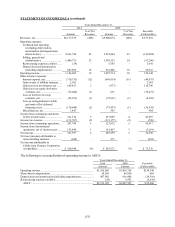
(55)
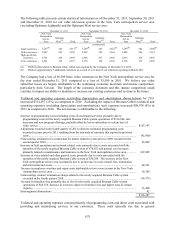
Income (loss) from discontinued operations
Income (loss) from discontinued operations, net of income taxes, for the years ended December 31, 2011
and 2010 reflects the following items:
Years Ended December 31,
2011 2010
Net operating results of AMC Networks, including transaction costs, net of
income taxes(a) ..................................................................................................... $53,623 $157,970
Net operating results of Madison Square Garden, including transaction costs,
net of income taxes(b) ........................................................................................... - (4,122)
$53,623 $153,848
______________
(a) Includes operating results of AMC Networks through the date of the AMC Networks Distribution.
(b) Includes operating results of the Madison Square Garden segment from January 1, 2010 through the date of the
MSG Distribution.
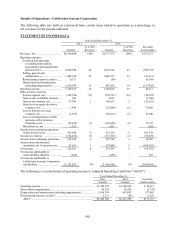
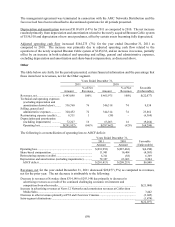
Business Segments Results
Telecommunications Services
The table below sets forth, for the periods presented, certain historical financial information and the
percentage that those items bear to revenues, net for our Telecommunications Services segment:
Years Ended December 31,
2011 2010
Amount
% of Net
Revenues
Amount
% of Net
Revenues
Favorable
(Unfavorable)
Revenues, net ..................
.
$6,279,653 100% $5,735,522 100% $ 544,131
Technical and operating
expenses (excluding
depreciation and
amortization shown
below) .........................
.
2,648,743 42 2,334,456 41 (314,287)
Selling, general and
administrative
expenses ......................
.
1,167,632 19 1,103,313 19 (64,319)
Depreciation and
amortization ................
.
942,647 15 824,029 14 (118,618)
Operating income ........
.
$1,520,631 24% $1,473,724 26% $ 46,907
The following is a reconciliation of operating income to AOCF:
Years Ended December 31,
2011 2010 Favorable
Amount Amount (Unfavorable)
Operating income ....................................................................
.
$1,520,631 $1,473,724 $ 46,907
Share-based compensation .......................................................
.
32,635 33,885 (1,250)
Depreciation and amortization .................................................
.
942,647 824,029 118,618
AOCF ...............................................................................
.
$2,495,913 $2,331,638 $164,275