Cablevision 2011 Annual Report Download - page 74
Download and view the complete annual report
Please find page 74 of the 2011 Cablevision annual report below. You can navigate through the pages in the report by either clicking on the pages listed below, or by using the keyword search tool below to find specific information within the annual report.-
 1
1 -
2
-
3
-
4
-
5
-
6
-
7
-
8
-
9
-
10
-
11
-
12
-
13
-
14
-
15
-
16
-
17
-
18
-
19
-
20
-
21
-
22
-
23
-
24
-
25
-
26
-
27
-
28
-
29
-
30
-
31
-
32
-
33
-
34
-
35
-
36
-
37
-
38
-
39
-
40
-
41
-
42
-
43
-
44
-
45
-
46
-
47
-
48
-
49
-
50
-
51
-
52
-
53
-
54
-
55
-
56
-
57
-
58
-
59
-
60
-
61
-
62
-
63
-
 64
64 -
 65
65 -
 66
66 -
 67
67 -
 68
68 -
 69
69 -
 70
70 -
 71
71 -
 72
72 -
 73
73 -
 74
74 -
 75
75 -
 76
76 -
 77
77 -
 78
78 -
 79
79 -
 80
80 -
 81
81 -
 82
82 -
 83
83 -
 84
84 -
85
-
86
-
87
-
88
-
89
-
90
-
91
-
92
-
93
-
94
-
95
-
96
-
97
-
98
-
99
-
100
-
101
-
102
-
103
-
104
-
105
-
106
-
107
-
108
-
109
-
110
-
111
-
112
-
113
-
114
-
115
-
116
-
117
-
118
-
119
-
120
-
121
-
122
-
123
-
124
-
125
-
126
-
127
-
128
-
129
-
130
-
131
-
132
-
133
-
134
-
135
-
136
-
137
-
138
-
139
-
140
-
141
-
142
-
143
-
144
-
145
-
146
-
147
-
148
-
149
-
150
-
151
-
152
-
153
-
154
-
155
-
156
-
157
-
158
-
159
-
160
-
161
-
162
-
163
-
164
-
165
-
166
-
167
-
168
-
169
-
170
-
171
-
172
-
173
-
174
-
175
-
176
-
177
-
178
-
179
-
180
-
181
-
182
-
183
-
184
-
185
-
186
-
187
-
188
-
189
-
190
-
191
-
192
-
193
-
194
-
195
-
196
-
197
-
198
-
199
-
200
-
201
-
202
-
203
-
204
-
205
-
206
-
207
-
208
-
209
-
210
-
211
-
212
-
213
-
214
-
215
-
216
-
217
-
218
-
219
-
220
 |
 |

(68)
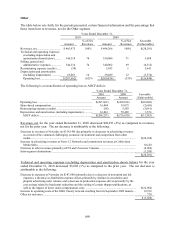
Other
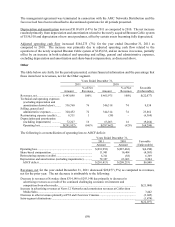
The table below sets forth, for the periods presented, certain financial information and the percentage that
those items bear to revenues, net for the Other segment.
Years Ended December 31,
2010 2009
Amount
% of Net
Revenues
Amount
% of Net
Revenues
Favorable
(Unfavorable)
Revenues, net ................................. $ 465,975 100% $ 494,266 100% $(28,291)
Technical and operating expenses
(excluding depreciation and
amortization shown below) ........ 346,318 74 350,006 71 3,688
Selling, general and
administrative expenses ............. 344,314 74 340,002 69 (4,312)
Restructuring expense (credits) ..... (58) - 5,583 1 5,641
Depreciation and amortization
(including impairments) ............ 63,063 14 59,489 12 (3,574)
Operating loss ............................ $(287,662) (62)% $(260,814) (53)% $(26,848)
The following is a reconciliation of operating loss to AOCF deficit:
Years Ended December 31,
2010 2009 Favorable
Amount Amount (Unfavorable)
Operating loss ...........................................................................
.
$(287,662) $(260,814) $(26,848)
Share-based compensation ........................................................
.
16,404 19,072 (2,668)
Restructuring expense (credits) .................................................
.
(58) 5,583 (5,641)
Depreciation and amortization (including impairments) ...........
.
63,063 59,489 3,574
AOCF deficit .........................................................................
.
$(208,253) $(176,670) $(31,583)
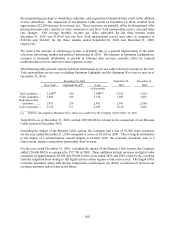
Revenues, net for the year ended December 31, 2010 decreased $28,291 (6%) as compared to revenues,
net for the prior year. The net decrease is attributable to the following:
Decrease in revenues at Newsday (to $314,148) due primarily to decreases in advertising revenues
as a result of the continued challenging economic environment and competition from other
media .................................................................................................................................................
.
$(28,188)
Increase in advertising revenues at News 12 Networks and commission revenues at Cablevision
Media Sales .......................................................................................................................................
.
10,128
Decrease in other revenues primarily at PVI and Clearview Cinemas .................................................
.
(8,986)
Intra-segment eliminations ...................................................................................................................
.
(1,245)
$(28,291)
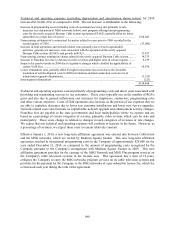
Technical and operating expenses (excluding depreciation and amortization shown below) for the year
ended December 31, 2010 decreased $3,688 (1%) as compared to the prior year. The net decrease is
attributable to the following:
Decrease in expenses at Newsday (to $187,606) primarily due to a decrease in newsprint and ink
expenses, a decrease in distribution expense driven primarily by declines in circulation and
preprint advertising sales volume, and a decrease in production expenses driven primarily by the
cost savings related to headcount reductions and the exiting of certain shopper publications, as
well as the impact of lower union compensation costs ....................................................................
.
$(22,982)
Increase in operating costs of the MSG Varsity network resulting from its September 2009 launch ...
.
18,516
Other net increases ................................................................................................................................ 778
$ (3,688)