Cablevision 2011 Annual Report Download - page 145
Download and view the complete annual report
Please find page 145 of the 2011 Cablevision annual report below. You can navigate through the pages in the report by either clicking on the pages listed below, or by using the keyword search tool below to find specific information within the annual report.-
 1
1 -
2
-
3
-
4
-
5
-
6
-
7
-
8
-
9
-
10
-
11
-
12
-
13
-
14
-
15
-
16
-
17
-
18
-
19
-
20
-
21
-
22
-
23
-
24
-
25
-
26
-
27
-
28
-
29
-
30
-
31
-
32
-
33
-
34
-
35
-
36
-
37
-
38
-
39
-
40
-
41
-
42
-
43
-
44
-
45
-
46
-
47
-
48
-
49
-
50
-
51
-
52
-
53
-
54
-
55
-
56
-
57
-
58
-
59
-
60
-
61
-
62
-
63
-
64
-
65
-
66
-
67
-
68
-
69
-
70
-
71
-
72
-
73
-
74
-
75
-
76
-
77
-
78
-
79
-
80
-
81
-
82
-
83
-
84
-
85
-
86
-
87
-
88
-
89
-
90
-
91
-
92
-
93
-
94
-
95
-
96
-
97
-
98
-
99
-
100
-
101
-
102
-
103
-
104
-
105
-
106
-
107
-
108
-
109
-
110
-
111
-
112
-
113
-
114
-
115
-
116
-
117
-
118
-
119
-
120
-
121
-
122
-
123
-
124
-
125
-
126
-
127
-
128
-
129
-
130
-
131
-
132
-
133
-
134
-
 135
135 -
 136
136 -
 137
137 -
 138
138 -
 139
139 -
 140
140 -
 141
141 -
 142
142 -
 143
143 -
 144
144 -
 145
145 -
 146
146 -
 147
147 -
 148
148 -
 149
149 -
 150
150 -
 151
151 -
 152
152 -
 153
153 -
 154
154 -
 155
155 -
156
-
157
-
158
-
159
-
160
-
161
-
162
-
163
-
164
-
165
-
166
-
167
-
168
-
169
-
170
-
171
-
172
-
173
-
174
-
175
-
176
-
177
-
178
-
179
-
180
-
181
-
182
-
183
-
184
-
185
-
186
-
187
-
188
-
189
-
190
-
191
-
192
-
193
-
194
-
195
-
196
-
197
-
198
-
199
-
200
-
201
-
202
-
203
-
204
-
205
-
206
-
207
-
208
-
209
-
210
-
211
-
212
-
213
-
214
-
215
-
216
-
217
-
218
-
219
-
220
 |
 |

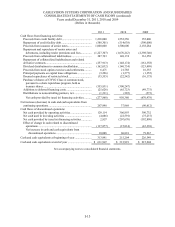
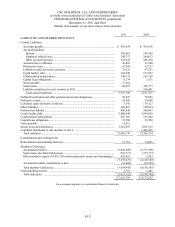
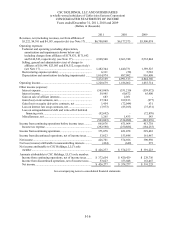
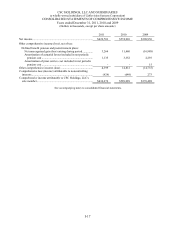
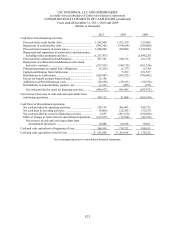
CSC HOLDINGS, LLC AND SUBSIDIARIES
(a wholly-owned subsidiary of Cablevision Systems Corporation)
CONSOLIDATED STATEMENTS OF CASH FLOWS (continued)
Years ended December 31, 2011, 2010 and 2009
(Dollars in thousands)
I-21
2011 2010 2009
Cash flows from financing activities:
Proceeds from credit facility debt .........................................
.
1,265,000 1,552,350 155,000
Repayment of credit facility debt ..........................................
.
(588,301) (514,638) (390,000)
Proceeds from issuance of senior notes .................................
.
1,000,000 250,000 1,250,920
Repayment and repurchase of senior notes and debentures,
including tender premiums and fees ..................................
.
(1,227,307) -
(1,898,225)
Proceeds from collateralized indebtedness ...........................
.
307,763 148,174 161,358
Repayment of collateralized indebtedness and related
derivative contracts ............................................................
.
(257,913) (148,174)
(161,358)
Principal payments on capital lease obligations ....................
.
(3,226) (1,377) (1,355)
Capital contributions from Cablevision ................................
.
- 5,259 871,597
Distributions to Cablevision ..................................................
.
(929,947) (556,272) (790,082)
Excess tax benefit on share-based awards .............................
.
11,196 - -
Additions to deferred financing costs....................................
.
(25,626) (39,131) (30,754)
Distributions to noncontrolling partners, net ........................
.
(1,311) (285) (573)
Net cash provided by (used in) financing activities ...........
.
(449,672) 695,906 (833,472)
Net increase (decrease) in cash and cash equivalents from
continuing operations ............................................................
.
334,132 31,884
(103,670)
Cash flows of discontinued operations:
Net cash provided by operating activities .............................
.
129,114 306,893 390,732
Net cash used in investing activities ....................................
.
(4,086) (22,591) (75,237)
Net cash provided by (used in) financing activities ..............
.
2,857 (207,670) (192,890)
Effect of change in cash related to discontinued operations .
.
(117,877) (15,814) (43,338)
Net increase in cash and cash equivalents from
discontinued operations .................................................
.
10,008 60,818 79,267
Cash and cash equivalents at beginning of year .......................
.
266,914 174,212 198,615
Cash and cash equivalents at end of year .................................
.
$ 611,054 $ 266,914 $ 174,212
See accompanying notes to consolidated financial statements.