BT 2012 Annual Report Download - page 7
Download and view the complete annual report
Please find page 7 of the 2012 BT annual report below. You can navigate through the pages in the report by either clicking on the pages listed below, or by using the keyword search tool below to find specific information within the annual report.-
 1
1 -
 2
2 -
 3
3 -
 4
4 -
 5
5 -
 6
6 -
 7
7 -
 8
8 -
 9
9 -
 10
10 -
 11
11 -
 12
12 -
 13
13 -
 14
14 -
 15
15 -
 16
16 -
 17
17 -
 18
18 -
19
-
20
-
21
-
22
-
23
-
24
-
25
-
26
-
27
-
28
-
29
-
30
-
31
-
32
-
33
-
34
-
35
-
36
-
37
-
38
-
39
-
40
-
41
-
42
-
43
-
44
-
45
-
46
-
47
-
48
-
49
-
50
-
51
-
52
-
53
-
54
-
55
-
56
-
57
-
58
-
59
-
60
-
61
-
62
-
63
-
64
-
65
-
66
-
67
-
68
-
69
-
70
-
71
-
72
-
73
-
74
-
75
-
76
-
77
-
78
-
79
-
80
-
81
-
82
-
83
-
84
-
85
-
86
-
87
-
88
-
89
-
90
-
91
-
92
-
93
-
94
-
95
-
96
-
97
-
98
-
99
-
100
-
101
-
102
-
103
-
104
-
105
-
106
-
107
-
108
-
109
-
110
-
111
-
112
-
113
-
114
-
115
-
116
-
117
-
118
-
119
-
120
-
121
-
122
-
123
-
124
-
125
-
126
-
127
-
128
-
129
-
130
-
131
-
132
-
133
-
134
-
135
-
136
-
137
-
138
-
139
-
140
-
141
-
142
-
143
-
144
-
145
-
146
-
147
-
148
-
149
-
150
-
151
-
152
-
153
-
154
-
155
-
156
-
157
-
158
-
159
-
160
-
161
-
162
-
163
-
164
-
165
-
166
-
167
-
168
-
169
-
170
-
171
-
172
-
173
-
174
-
175
-
176
-
177
-
178
-
179
-
180
-
181
-
182
-
183
-
184
-
185
-
186
-
187
-
188
-
189
-
190
-
191
-
192
-
193
-
194
-
195
-
196
-
197
-
198
-
199
-
200
-
201
-
202
-
203
-
204
-
205
 |
 |

4Overview
A better
future
A better
business
bAdjusted free cash flow is a non-GAAP measure. c Cumulative improvement from 1 April 2007.
0
10
5
15
20
25
2008 2009 2010 20122011
0
500
1,000
1,500
2,000
2,500
2008 20102009 2011 2012
a
Adjusted earnings per share is stated before specific items.
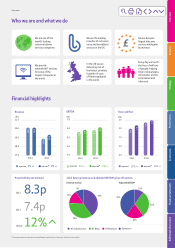
Key performance indicators
We measure our overall progress by using three key performance indicators, which all showed improvement this year.
Adjusted earnings per sharea
28
Read more about customer
service improvement on page
28
2,266
772
2,106
2,223
2,522
Read more about adjusted
free cash flow on page
28
20.2
14.1
17.3
Read more about adjusted
earnings per share on page
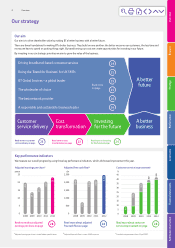
Our aim
Our aim is to drive shareholder value by making BT a better business with a better future.
There are three foundations for making BT a better business. They build on one another: the better we serve our customers, the less time and
money we have to spend on putting things right. By transforming our costs we create opportunities for investing in our future.
By investing in our six strategic priorities we aim to grow the value of the business.
Our strategy
Read more on cost
transformation on page 23 Read more on investing
for the future on page 24
23
Read more on customer
service delivery on page
23.7
21.0
Adjusted free cash flowb
pence £m
Customer
service delivery Cost
transformation Investing
for the future
Read more
on page
25
25
26
24
25
26
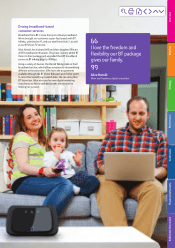
Driving broadband-based consumer services
Being the ‘Brand for Business’ for UK SMEs
BT Global Services – a global leader
The wholesaler of choice
The best network provider
A responsible and sustainable business leader
9.0
2010
10.5
2011 2012
3.0
3.0
2009
17.0
2008
0
35
30
25
20
15
10
5
40
45
Customer service improvementc
%
Overview
BusinessStrategy
Performance
Governance
Financial statements
Additional information Overview
BusinessStrategy
Performance
Governance
Financial statements
Additional information