Air France 2008 Annual Report Download - page 7
Download and view the complete annual report
Please find page 7 of the 2008 Air France annual report below. You can navigate through the pages in the report by either clicking on the pages listed below, or by using the keyword search tool below to find specific information within the annual report.-
 1
1 -
 2
2 -
 3
3 -
 4
4 -
 5
5 -
 6
6 -
 7
7 -
 8
8 -
 9
9 -
 10
10 -
 11
11 -
 12
12 -
 13
13 -
 14
14 -
 15
15 -
 16
16 -
 17
17 -
 18
18 -
19
-
20
-
21
-
22
-
23
-
24
-
25
-
26
-
27
-
28
-
29
-
30
-
31
-
32
-
33
-
34
-
35
-
36
-
37
-
38
-
39
-
40
-
41
-
42
-
43
-
44
-
45
-
46
-
47
-
48
-
49
-
50
-
51
-
52
-
53
-
54
-
55
-
56
-
57
-
58
-
59
-
60
-
61
-
62
-
63
-
64
-
65
-
66
-
67
-
68
-
69
-
70
-
71
-
72
-
73
-
74
-
75
-
76
-
77
-
78
-
79
-
80
-
81
-
82
-
83
-
84
-
85
-
86
-
87
 |
 |

7
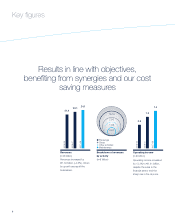
2006-07
2007-08
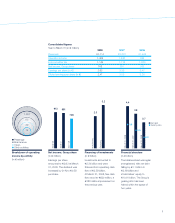
Net income, Group share
(in million)
Earnings per share
amounted to 2.63 at March
31, 2008. The dividend was
increased by 21% to 0.58
per share.
891
2005-06
913
748
March 31, 2006
March 31, 2008
Financial structure
(in billion)
The balance sheet was again
strengthened, with net debt
falling by 1.1 billion to
2.69 billion and
stockholders’ equity to
10.61 billion. The Group’s
gearing ratio has been
halved within the space of
two years.
4.4
March 31, 2007
3.8
2.7
Investments
Financing of investments
(in billion)
Investments amounted to
2.34 billion and were
financed from operating cash
flow of 2.59 billion.
At March 31, 2008, free cash
flow stood at 820 million, a
188 million improvement on
the previous year.
2.3
Financing
3.2
2008 2007 2006
Revenues 24,114 23,073 21,448
Operating income 1,405 1,240 936
Income before tax 1,149 1,118 1,200
Net income, Group share 748 891 913
Earnings per share (in )2.63 3.35 3.47
Diluted earnings per share (in )2.47 3.05 3.25
1, 291
63
39
12
Breakdown of operating
income by activity
(in million)
●Passenger
●Maintenance
●Cargo
●Other activities
Consolidated figures
Year to March 31 (in million)
●0.6
●0.5
●0.3
■Net debt
●Gearing ratio