XM Radio 2013 Annual Report Download - page 87
Download and view the complete annual report
Please find page 87 of the 2013 XM Radio annual report below. You can navigate through the pages in the report by either clicking on the pages listed below, or by using the keyword search tool below to find specific information within the annual report.-
 1
1 -
2
-
3
-
4
-
5
-
6
-
7
-
8
-
9
-
10
-
11
-
12
-
13
-
14
-
15
-
16
-
17
-
18
-
19
-
20
-
21
-
22
-
23
-
24
-
25
-
26
-
27
-
28
-
29
-
30
-
31
-
32
-
33
-
34
-
35
-
36
-
37
-
38
-
39
-
40
-
41
-
42
-
43
-
44
-
45
-
46
-
47
-
48
-
49
-
50
-
51
-
52
-
53
-
54
-
55
-
56
-
57
-
58
-
59
-
60
-
61
-
62
-
63
-
64
-
65
-
66
-
67
-
68
-
69
-
70
-
71
-
72
-
73
-
74
-
75
-
76
-
 77
77 -
 78
78 -
 79
79 -
 80
80 -
 81
81 -
 82
82 -
 83
83 -
 84
84 -
 85
85 -
 86
86 -
 87
87 -
 88
88 -
 89
89 -
 90
90 -
 91
91 -
 92
92 -
 93
93 -
 94
94 -
 95
95 -
 96
96 -
 97
97 -
98
-
99
-
100
-
101
-
102
-
103
-
104
-
105
-
106
-
107
-
108
-
109
-
110
-
111
-
112
-
113
-
114
-
115
-
116
-
117
-
118
-
119
-
120
-
121
-
122
-
123
-
124
-
125
-
126
-
127
-
128
-
129
-
130
-
131
-
132
-
133
-
134
-
135
-
136
 |
 |

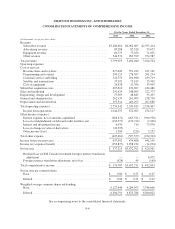
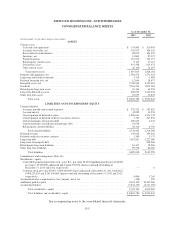
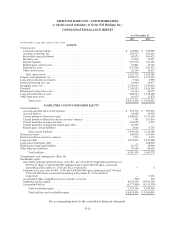
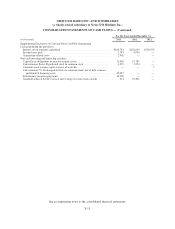
SIRIUS XM HOLDINGS INC. AND SUBSIDIARIES
CONSOLIDATED BALANCE SHEETS
As of December 31,
2013 2012
(in thousands, except share and per share data)
ASSETS
Current assets:
Cash and cash equivalents ........................................................... $ 134,805 $ 520,945
Accounts receivable, net ............................................................. 103,937 106,142
Receivables from distributors ......................................................... 88,975 104,425
Inventory, net ..................................................................... 13,863 25,337
Prepaid expenses ................................................................... 110,530 122,157
Related party current assets .......................................................... 9,145 13,167
Deferred tax asset .................................................................. 937,598 923,972
Other current assets ................................................................. 20,160 12,037
Total current assets ............................................................... 1,419,013 1,828,182
Property and equipment, net ............................................................ 1,594,574 1,571,922
Long-term restricted investments ........................................................ 5,718 3,999
Deferred financing fees, net ............................................................ 12,604 38,677
Intangible assets, net .................................................................. 2,700,062 2,519,610
Goodwill ........................................................................... 2,204,553 1,815,365
Related party long-term assets .......................................................... 30,164 44,954
Long-term deferred tax asset ........................................................... 868,057 1,219,256
Other long-term assets ................................................................ 10,035 12,878
Total assets ................................................................... $8,844,780 $ 9,054,843
LIABILITIES AND STOCKHOLDERS’ EQUITY
Current liabilities:
Accounts payable and accrued expenses ................................................ $ 578,333 $ 587,652
Accrued interest ................................................................... 42,085 33,954
Current portion of deferred revenue .................................................... 1,586,611 1,474,138
Current portion of deferred credit on executory contracts ................................... 3,781 207,854
Current maturities of long-term debt ................................................... 496,815 4,234
Current maturities of long-term related party debt ......................................... 10,959 —
Related party current liabilities ........................................................ 20,320 6,756
Total current liabilities .......................................................... 2,738,904 2,314,588
Deferred revenue .................................................................... 149,026 159,501
Deferred credit on executory contracts .................................................... 1,394 5,175
Long-term debt ...................................................................... 3,093,821 2,222,080
Long-term related party debt ........................................................... — 208,906
Related party long-term liabilities ....................................................... 16,337 18,966
Other long-term liabilities .............................................................. 99,556 86,062
Total liabilities ................................................................ 6,099,038 5,015,278
Commitments and contingencies (Note 16)
Stockholders’ equity:
Convertible perpetual preferred stock, series B-1, par value $0.001 (liquidation preference of $0.001
per share); 50,000,000 authorized and 0 and 6,250,100 shares issued and outstanding at
December 31, 2013 and 2012, respectively ............................................ — 6
Common stock, par value $0.001; 9,000,000,000 shares authorized at December 31, 2013 and 2012;
6,096,220,526 and 5,262,440,085 shares issued and outstanding at December 31, 2013 and 2012,
respectively ..................................................................... 6,096 5,263
Accumulated other comprehensive (loss) income, net of tax ................................... (308) 120
Additional paid-in capital .............................................................. 8,674,129 10,345,566
Accumulated deficit .................................................................. (5,934,175) (6,311,390)
Total stockholders’ equity ....................................................... 2,745,742 4,039,565
Total liabilities and stockholders’ equity ............................................ $8,844,780 $ 9,054,843
See accompanying notes to the consolidated financial statements.
F-5