XM Radio 2013 Annual Report Download - page 59
Download and view the complete annual report
Please find page 59 of the 2013 XM Radio annual report below. You can navigate through the pages in the report by either clicking on the pages listed below, or by using the keyword search tool below to find specific information within the annual report.-
 1
1 -
2
-
3
-
4
-
5
-
6
-
7
-
8
-
9
-
10
-
11
-
12
-
13
-
14
-
15
-
16
-
17
-
18
-
19
-
20
-
21
-
22
-
23
-
24
-
25
-
26
-
27
-
28
-
29
-
30
-
31
-
32
-
33
-
34
-
35
-
36
-
37
-
38
-
39
-
40
-
41
-
42
-
43
-
44
-
45
-
46
-
47
-
48
-
 49
49 -
 50
50 -
 51
51 -
 52
52 -
 53
53 -
 54
54 -
 55
55 -
 56
56 -
 57
57 -
 58
58 -
 59
59 -
 60
60 -
 61
61 -
 62
62 -
 63
63 -
 64
64 -
 65
65 -
 66
66 -
 67
67 -
 68
68 -
 69
69 -
70
-
71
-
72
-
73
-
74
-
75
-
76
-
77
-
78
-
79
-
80
-
81
-
82
-
83
-
84
-
85
-
86
-
87
-
88
-
89
-
90
-
91
-
92
-
93
-
94
-
95
-
96
-
97
-
98
-
99
-
100
-
101
-
102
-
103
-
104
-
105
-
106
-
107
-
108
-
109
-
110
-
111
-
112
-
113
-
114
-
115
-
116
-
117
-
118
-
119
-
120
-
121
-
122
-
123
-
124
-
125
-
126
-
127
-
128
-
129
-
130
-
131
-
132
-
133
-
134
-
135
-
136
 |
 |
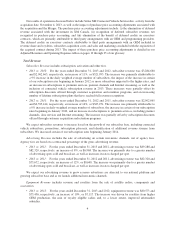
Cost of Equipment includes costs from the sale of satellite radios, components and accessories and
provisions for inventory allowance attributable to products purchased for resale in our direct to consumer
distribution channels.
•2013 vs. 2012: For the years ended December 31, 2013 and 2012, cost of equipment was $26,478 and
$31,766, respectively, a decrease of 17%, or $5,288, and decreased as a percentage of equipment revenue.
The decrease was primarily due to lower average cost per product sold and lower inventory reserves,
partially offset by higher direct to consumer volume compared to prior year periods.
•2012 vs. 2011: For the years ended December 31, 2012 and 2011, cost of equipment was $31,766 and
$33,095, respectively, a decrease of 4%, or $1,329, and decreased as a percentage of equipment revenue.
The decrease was primarily due to lower direct to consumer sales, partially offset by higher inventory
reserves.
We expect cost of equipment to vary with changes in sales, supply chain management and inventory
valuations.
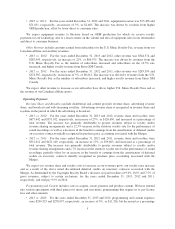
Subscriber Acquisition Costs include hardware subsidies paid to radio manufacturers, distributors and
automakers, including subsidies paid to automakers who include a satellite radio and subscription to our service
in the sale or lease price of a new vehicle; subsidies paid for chip sets and certain other components used in
manufacturing radios; device royalties for certain radios and chip sets; commissions paid to automakers as
incentives to purchase, install and activate satellite radios; product warranty obligations; freight; and provisions
for inventory allowances attributable to inventory consumed in our OEM and retail distribution channels. The
majority of subscriber acquisition costs are incurred and expensed in advance of, or concurrent with, acquiring a
subscriber. Subscriber acquisition costs do not include advertising, marketing, loyalty payments to distributors
and dealers of satellite radios or revenue share payments to automakers and retailers of satellite radios.
•2013 vs. 2012: For the years ended December 31, 2013 and 2012, subscriber acquisition costs were
$495,610 and $474,697, respectively, an increase of 4%, or $20,913, but decreased as a percentage of
total revenue. The increase was primarily a result of higher subsidies related to increased OEM
installations and lower benefit to earnings from the amortization of the deferred credit for acquired
executory contracts recognized in purchase price accounting associated with the Merger, partially offset
by improved OEM subsidy rates per vehicle.
•2012 vs. 2011: For the years ended December 31, 2012 and 2011, subscriber acquisition costs were
$474,697 and $434,482, respectively, an increase of 9%, or $40,215, but decreased as a percentage of
total revenue. The increase was primarily a result of higher subsidies related to increased OEM
installations occurring in advance of acquiring the subscriber, partially offset by improved OEM subsidy
rates per vehicle and increases in the benefit to earnings from the amortization of the deferred credit for
acquired executory contracts recognized in purchase price accounting associated with the Merger.
We expect total subscriber acquisition costs to decrease as a result of the expiration of the acquired
executory contracts noted above. The decrease will be partially offset by increases in OEM installations and
gross subscriber additions. Changes in contractual OEM subsidy rates and the cost of subsidized radio
components will also impact total subscriber acquisition costs. We intend to continue to offer subsidies,
commissions and other incentives to acquire subscribers.
Sales and Marketing includes costs for advertising, media and production, including promotional events and
sponsorships; cooperative marketing; customer acquisition and retention, and personnel. Cooperative marketing
costs include fixed and variable payments to reimburse retailers and automakers for the cost of advertising and
other product awareness activities performed on our behalf. Customer acquisition and retention costs include
expenses related to direct mail, outbound telemarketing and email communications.
•2013 vs. 2012: For the years ended December 31, 2013 and 2012, sales and marketing expenses were
$291,024 and $248,905, respectively, an increase of 17%, or $42,119, and increased as a percentage of
7