XM Radio 2013 Annual Report Download - page 64
Download and view the complete annual report
Please find page 64 of the 2013 XM Radio annual report below. You can navigate through the pages in the report by either clicking on the pages listed below, or by using the keyword search tool below to find specific information within the annual report.-
 1
1 -
2
-
3
-
4
-
5
-
6
-
7
-
8
-
9
-
10
-
11
-
12
-
13
-
14
-
15
-
16
-
17
-
18
-
19
-
20
-
21
-
22
-
23
-
24
-
25
-
26
-
27
-
28
-
29
-
30
-
31
-
32
-
33
-
34
-
35
-
36
-
37
-
38
-
39
-
40
-
41
-
42
-
43
-
44
-
45
-
46
-
47
-
48
-
49
-
50
-
51
-
52
-
53
-
 54
54 -
 55
55 -
 56
56 -
 57
57 -
 58
58 -
 59
59 -
 60
60 -
 61
61 -
 62
62 -
 63
63 -
 64
64 -
 65
65 -
 66
66 -
 67
67 -
 68
68 -
 69
69 -
 70
70 -
 71
71 -
 72
72 -
 73
73 -
 74
74 -
75
-
76
-
77
-
78
-
79
-
80
-
81
-
82
-
83
-
84
-
85
-
86
-
87
-
88
-
89
-
90
-
91
-
92
-
93
-
94
-
95
-
96
-
97
-
98
-
99
-
100
-
101
-
102
-
103
-
104
-
105
-
106
-
107
-
108
-
109
-
110
-
111
-
112
-
113
-
114
-
115
-
116
-
117
-
118
-
119
-
120
-
121
-
122
-
123
-
124
-
125
-
126
-
127
-
128
-
129
-
130
-
131
-
132
-
133
-
134
-
135
-
136
 |
 |
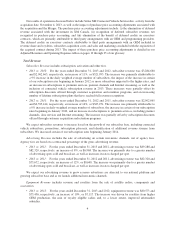
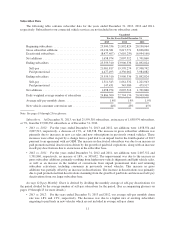
•2012 vs. 2011: For the years ended December 31, 2012 and 2011, our average self-pay monthly churn
rate was 1.9%.
New Vehicle Consumer Conversion Rate is the percentage of owners and lessees of new vehicles that
receive our service and convert to become self-paying subscribers after an initial promotional period. The metric
excludes rental and fleet vehicles. (See accompanying glossary on pages 19 through 25 for more details).
•2013 vs. 2012: For the years ended December 31, 2013 and 2012, the new vehicle consumer conversion
rate was 44% and 45%, respectively. The decrease in the new vehicle consumer conversion rate for the
twelve month period was primarily due to the mix of sales by OEMs.
•2012 vs. 2011: For the years ended December 31, 2012 and 2011, the new vehicle consumer conversion
rate was 45%.
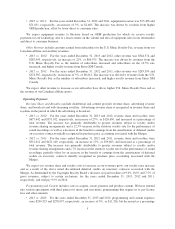
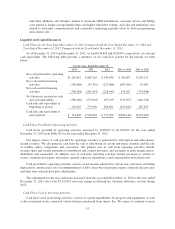
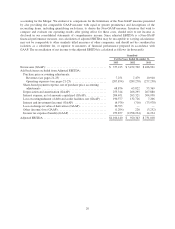
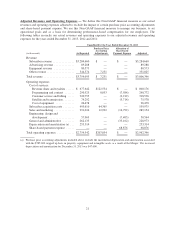
Adjusted Results of Operations
In this section, we present certain financial performance measures that are not calculated and presented in
accordance with generally accepted accounting principles in the United States (“Non-GAAP”). These Non-
GAAP financial measures include: average monthly revenue per subscriber, or ARPU; customer service and
billing expenses, per average subscriber; subscriber acquisition cost, or SAC, per gross subscriber addition; free
cash flow; and adjusted EBITDA. These measures exclude the impact of certain purchase price accounting
adjustments. We use these Non-GAAP financial measures to manage our business, to set operational goals and as
a basis for determining performance-based compensation for our employees.
The purchase price accounting adjustments include the elimination of the earnings benefit of deferred
revenue associated with our investment in Sirius XM Canada, the recognition of subscriber revenues not
recognized in purchase price accounting and the elimination of the earnings benefit of deferred credits on
executory contracts, which are primarily attributable to third party arrangements with an OEM and certain
programming providers.
We believe the exclusion of share-based payment expense from functional operating expenses is useful
given the significant variation in expense that can result from changes in the fair value as determined by the
Black-Scholes-Merton model, which varies based on assumptions used for the expected life, expected stock price
volatility and risk-free interest rates, the effect of which is unrelated to the operational conditions that give rise to
variations in the components of our operating costs.
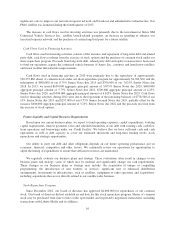
Free cash flow is a metric that our management and board of directors use to evaluate the cash generated by
our operations, net of capital expenditures and other investment activity. In a capital intensive business, with
significant investments in satellites, we look at our operating cash flow, net of these investing cash outflows, to
determine cash available for future subscriber acquisition and capital expenditures, to repurchase or retire debt, to
acquire other companies and to evaluate our ability to return capital to stockholders. We believe free cash flow is
an indicator of the long-term financial stability of our business. Free cash flow, which is reconciled to “Net cash
provided by operating activities”, is a Non-GAAP financial measure. This measure can be calculated by
deducting amounts under the captions “Additions to property and equipment” and deducting or adding Restricted
and other investment activity from “Net cash provided by operating activities” from the audited consolidated
statements of cash flows. Free cash flow should be used in conjunction with other GAAP financial performance
measures and may not be comparable to free cash flow measures presented by other companies. Free cash flow
should be viewed as a supplemental measure rather than an alternative measure of cash flows from operating
activities, as determined in accordance with GAAP. Free cash flow is limited and does not represent remaining
cash flows available for discretionary expenditures due to the fact that the measure does not deduct the payments
required for debt maturities. We believe free cash flow provides useful supplemental information to investors
regarding our current and projected cash flow, along with other GAAP measures (such as cash flows from
operating and investing activities), to determine our financial condition, and to compare our operating
performance to other communications, entertainment and media companies.
12