XM Radio 2010 Annual Report Download - page 95
Download and view the complete annual report
Please find page 95 of the 2010 XM Radio annual report below. You can navigate through the pages in the report by either clicking on the pages listed below, or by using the keyword search tool below to find specific information within the annual report.-
 1
1 -
2
-
3
-
4
-
5
-
6
-
7
-
8
-
9
-
10
-
11
-
12
-
13
-
14
-
15
-
16
-
17
-
18
-
19
-
20
-
21
-
22
-
23
-
24
-
25
-
26
-
27
-
28
-
29
-
30
-
31
-
32
-
33
-
34
-
35
-
36
-
37
-
38
-
39
-
40
-
41
-
42
-
43
-
44
-
45
-
46
-
47
-
48
-
49
-
50
-
51
-
52
-
53
-
54
-
55
-
56
-
57
-
58
-
59
-
60
-
61
-
62
-
63
-
64
-
65
-
66
-
67
-
68
-
69
-
70
-
71
-
72
-
73
-
74
-
75
-
76
-
77
-
78
-
79
-
80
-
81
-
82
-
83
-
84
-
 85
85 -
 86
86 -
 87
87 -
 88
88 -
 89
89 -
 90
90 -
 91
91 -
 92
92 -
 93
93 -
 94
94 -
 95
95 -
 96
96 -
 97
97 -
 98
98 -
 99
99 -
 100
100 -
 101
101 -
 102
102 -
 103
103 -
 104
104 -
 105
105 -
106
-
107
-
108
-
109
-
110
-
111
-
112
-
113
-
114
-
115
-
116
-
117
-
118
-
119
-
120
-
121
-
122
-
123
-
124
-
125
-
126
-
127
-
128
-
129
-
130
-
131
-
132
-
133
-
134
-
135
-
136
 |
 |

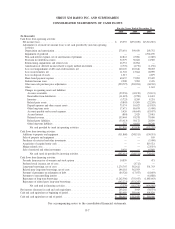
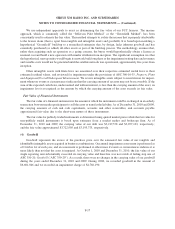
SIRIUS XM RADIO INC. AND SUBSIDIARIES
CONSOLIDATED STATEMENTS OF CASH FLOWS
2010 2009 2008
For the Years Ended December 31,
(In thousands)
Cash flows from operating activities:
Net income (loss) .................................................. $ 43,055 $(352,038) $(5,316,910)
Adjustments to reconcile net income (loss) to net cash provided by (used in) operating
activities:
Depreciation and amortization ........................................ 273,691 309,450 203,752
Impairment of goodwill . . . ......................................... — — 4,766,190
Non-cash interest expense, net of amortization of premium ..................... 42,841 43,066 (2,689)
Provision for doubtful accounts . . . .................................... 32,379 30,602 21,589
Restructuring, impairments and related costs .............................. 66,731 26,964 —
Amortization of deferred income related to equity method investment . . . ........... (2,776) (2,776) (1,156)
Loss on extinguishment of debt and credit facilities, net . . ..................... 120,120 267,646 98,203
Loss on investments, net . . ......................................... 11,722 13,664 28,999
Loss on disposal of assets . . ......................................... 1,017 — 4,879
Share-based payment expense ........................................ 60,437 73,981 87,405
Deferred income taxes ............................................. 2,308 5,981 2,476
Other non-cash purchase price adjustments. ............................... (250,727) (202,054) (68,330)
Other ........................................................ — — 1,643
Changes in operating assets and liabilities:
Accounts receivable ............................................. (39,236) (42,158) (32,121)
Receivables from distributors . . . .................................... (11,023) (2,788) 14,401
Inventory . ................................................... (5,725) 8,269 8,291
Related party assets ............................................. (9,803) 15,305 (22,249)
Prepaid expenses and other current assets ............................... 75,374 10,027 (19,953)
Other long-term assets . . ......................................... 17,671 86,674 (5,490)
Accounts payable and accrued expenses . ............................... 5,420 (46,645) (83,037)
Accrued interest . .............................................. (884) 2,429 23,081
Deferred revenue . .............................................. 133,444 93,578 79,090
Related party liabilities . . ......................................... (53,413) 50,172 28,890
Other long-term liabilities ......................................... 272 44,481 30,249
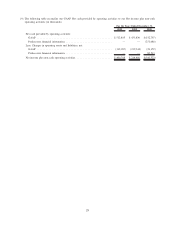
Net cash provided by (used in) operating activities . . ..................... 512,895 433,830 (152,797)
Cash flows from investing activities:
Additions to property and equipment . .................................... (311,868) (248,511) (130,551)
Sales of property and equipment ........................................ — — 105
Purchases of restricted and other investments . ............................... — — (3,000)
Acquisition of acquired entity cash . . .................................... — — 819,521
Merger related costs . . .............................................. — — (23,519)
Sale of restricted and other investments ................................... 9,454 — 65,869
Net cash (used in) provided by investing activities. . . ..................... (302,414) (248,511) 728,425
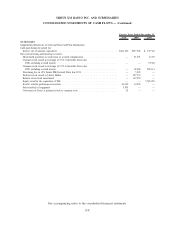
Cash flows from financing activities:
Proceeds from exercise of warrants and stock options .......................... 10,839 — 471
Preferred stock issuance, net of costs . .................................... — (3,712) —
Long-term borrowings, net of costs . . .................................... 1,274,707 582,612 531,743
Related party long-term borrowings, net of costs . . . .......................... 196,118 362,593 —
Payment of premiums on redemption of debt . ............................... (84,326) (17,075) (18,693)
Payments to noncontrolling interest . . .................................... — — (61,880)
Repayment of long-term borrowings . .................................... (1,262,396) (755,447) (1,085,643)
Repayment of related party long-term borrowings . . . .......................... (142,221) (351,247) —
Net cash used in financing activities . . ............................... (7,279) (182,276) (634,002)
Net increase (decrease) in cash and cash equivalents. . . .......................... 203,202 3,043 (58,374)
Cash and cash equivalents at beginning of period ............................... 383,489 380,446 438,820
Cash and cash equivalents at end of period ................................... $ 586,691 $ 383,489 $ 380,446
See accompanying notes to the consolidated financial statements.
F-7