XM Radio 2010 Annual Report Download - page 87
Download and view the complete annual report
Please find page 87 of the 2010 XM Radio annual report below. You can navigate through the pages in the report by either clicking on the pages listed below, or by using the keyword search tool below to find specific information within the annual report.-
 1
1 -
2
-
3
-
4
-
5
-
6
-
7
-
8
-
9
-
10
-
11
-
12
-
13
-
14
-
15
-
16
-
17
-
18
-
19
-
20
-
21
-
22
-
23
-
24
-
25
-
26
-
27
-
28
-
29
-
30
-
31
-
32
-
33
-
34
-
35
-
36
-
37
-
38
-
39
-
40
-
41
-
42
-
43
-
44
-
45
-
46
-
47
-
48
-
49
-
50
-
51
-
52
-
53
-
54
-
55
-
56
-
57
-
58
-
59
-
60
-
61
-
62
-
63
-
64
-
65
-
66
-
67
-
68
-
69
-
70
-
71
-
72
-
73
-
74
-
75
-
76
-
 77
77 -
 78
78 -
 79
79 -
 80
80 -
 81
81 -
 82
82 -
 83
83 -
 84
84 -
 85
85 -
 86
86 -
 87
87 -
 88
88 -
 89
89 -
 90
90 -
 91
91 -
 92
92 -
 93
93 -
 94
94 -
 95
95 -
 96
96 -
 97
97 -
98
-
99
-
100
-
101
-
102
-
103
-
104
-
105
-
106
-
107
-
108
-
109
-
110
-
111
-
112
-
113
-
114
-
115
-
116
-
117
-
118
-
119
-
120
-
121
-
122
-
123
-
124
-
125
-
126
-
127
-
128
-
129
-
130
-
131
-
132
-
133
-
134
-
135
-
136
 |
 |

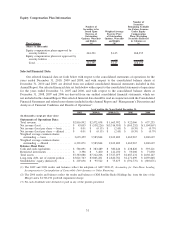
Equity Compensation Plan Information
Plan Category
Number of
Securities to be
Issued Upon
Exercise of
Outstanding
Options, Warrants
and Rights
(a)
Weighted-Average
Exercise Price
of Outstanding
Options, Warrants
and Rights
(b)
Number of
Securities
Remaining Available
for Future Issuance
Under Equity
Compensation
Plans (Excluding
Securities Reflected
in Column (a))
(c)
(Shares in thousands)
Equity compensation plans approved by
security holders .................... 444,291 $1.45 268,255
Equity compensation plans not approved by
security holders .................... — — —
Total . . .......................... 444,291 $1.45 268,255
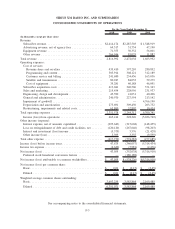
Selected Financial Data
Our selected financial data set forth below with respect to the consolidated statements of operations for the
years ended December 31, 2010, 2009 and 2008, and with respect to the consolidated balance sheets at
December 31, 2010 and 2009, are derived from our audited consolidated financial statements included in this
Annual Report. Our selected financial data set forth below with respect to the consolidated statements of operations
for the years ended December 31, 2007 and 2006, and with respect to the consolidated balance sheets at
December 31, 2008, 2007 and 2006 are derived from our audited consolidated financial statements, which are
not included in this Annual Report. This selected financial data should be read in conjunction with the Consolidated
Financial Statements and related notes thereto included in this Annual Report and “Management’s Discussion and
Analysis of Financial Condition and Results of Operations”.
2010 2009(1) 2008(1)(2) 2007 2006
As of and for the Years Ended December 31,
(In thousands, except per share data)
Statements of Operations Data:
Total revenue ...................... $2,816,992 $2,472,638 $ 1,663,992 $ 922,066 $ 637,235
Net income (loss) . . ................. $ 43,055 $ (538,226) $(5,316,910) $ (565,252) $(1,104,867)
Net income (loss) per share — basic ..... $ 0.01 $ (0.15) $ (2.45) $ (0.39) $ (0.79)
Net income (loss) per share — diluted . . . . $ 0.01 $ (0.15) $ (2.45) $ (0.39) $ (0.79)
Weighted average common shares
outstanding — basic . . . ............ 3,693,259 3,585,864 2,169,489 1,462,967 1,402,619
Weighted average common shares
outstanding — diluted . . ............ 6,391,071 3,585,864 2,169,489 1,462,967 1,402,619
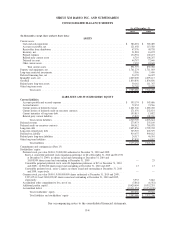
Balance Sheet Data:
Cash and cash equivalents. ............ $ 586,691 $ 383,489 $ 380,446 $ 438,820 $ 393,421
Restricted investments . . . ............ $ 3,396 $ 3,400 $ 141,250 $ 53,000 $ 77,850
Total assets ....................... $7,383,086 $7,322,206 $ 7,527,075 $1,687,231 $ 1,650,147
Long-term debt, net of current portion . . . . $3,021,763 $3,063,281 $ 2,820,781 $1,271,699 $ 1,059,868
Stockholders’ equity (deficit)(3) . . ...... $ 207,636 $ 95,522 $ 75,875 $ (792,737) $ (389,071)
(1) The 2009 and 2008 results and balances reflect the adoption of ASU 2009-15, Accounting for Own-Share Lending
Arrangements in Contemplation of Convertible Debt Issuance or Other Financing.
(2) The 2008 results and balances reflect the results and balances of XM Satellite Radio Holdings Inc. from the date of the
Merger and a $4,766,190 goodwill impairment charge.
(3) No cash dividends were declared or paid in any of the periods presented.
31