XM Radio 2010 Annual Report Download - page 71
Download and view the complete annual report
Please find page 71 of the 2010 XM Radio annual report below. You can navigate through the pages in the report by either clicking on the pages listed below, or by using the keyword search tool below to find specific information within the annual report.-
 1
1 -
2
-
3
-
4
-
5
-
6
-
7
-
8
-
9
-
10
-
11
-
12
-
13
-
14
-
15
-
16
-
17
-
18
-
19
-
20
-
21
-
22
-
23
-
24
-
25
-
26
-
27
-
28
-
29
-
30
-
31
-
32
-
33
-
34
-
35
-
36
-
37
-
38
-
39
-
40
-
41
-
42
-
43
-
44
-
45
-
46
-
47
-
48
-
49
-
50
-
51
-
52
-
53
-
54
-
55
-
56
-
57
-
58
-
59
-
60
-
 61
61 -
 62
62 -
 63
63 -
 64
64 -
 65
65 -
 66
66 -
 67
67 -
 68
68 -
 69
69 -
 70
70 -
 71
71 -
 72
72 -
 73
73 -
 74
74 -
 75
75 -
 76
76 -
 77
77 -
 78
78 -
 79
79 -
 80
80 -
 81
81 -
82
-
83
-
84
-
85
-
86
-
87
-
88
-
89
-
90
-
91
-
92
-
93
-
94
-
95
-
96
-
97
-
98
-
99
-
100
-
101
-
102
-
103
-
104
-
105
-
106
-
107
-
108
-
109
-
110
-
111
-
112
-
113
-
114
-
115
-
116
-
117
-
118
-
119
-
120
-
121
-
122
-
123
-
124
-
125
-
126
-
127
-
128
-
129
-
130
-
131
-
132
-
133
-
134
-
135
-
136
 |
 |

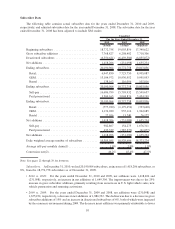
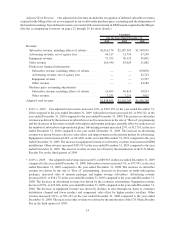
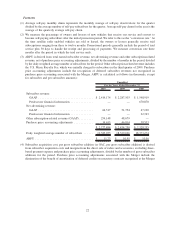
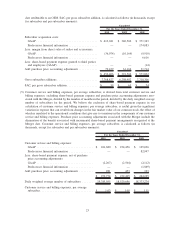
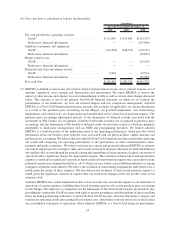
Adjusted EBITDA. EBITDA is defined as net income (loss) before interest and investment income (loss);
interest expense, net of amounts capitalized; income tax expense and depreciation and amortization. Adjusted
EBITDA removes the impact of other income and expense, losses on extinguishment of debt as well as certain other
charges, such as, goodwill impairment; restructuring, impairments and related costs; certain purchase price
accounting adjustments and share-based payment expense. (See the accompanying footnotes on pages 22 through
29 for more details):
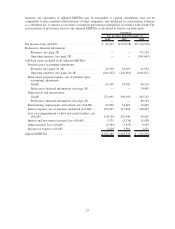
2010 2009 2008
For the Years Ended December 31,
Unaudited
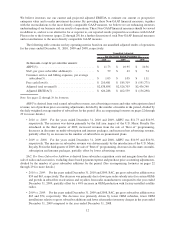
Adjusted EBITDA ................................. $626,288 $462,539 $(136,298)
•2010 vs. 2009: For the years ended December 31, 2010 and 2009, adjusted EBITDA was $626,288 and
$462,539, respectively, an increase of 35%, or $163,749. The increase was primarily due to an increase of
12%, or $312,195, in revenues, partially offset by an increase of 7%, or $148,446, in expenses included in
adjusted EBITDA. The increase in revenue was primarily due to the increase in our subscriber base and the
introduction of the U.S. Music Royalty Fee in the third quarter of 2009, as well as increased advertising and
equipment revenue, decreases in discounts on multi-subscription and internet packages, and an increase in
the sale of “Best of” programming, partially offset by an increase in the number of subscribers on
promotional plans. The increase in expenses was primarily driven by higher subscriber acquisition costs
related to the 25% increase in gross additions and higher revenue share and royalties expenses associated
with growth in revenues subject to revenue sharing and royalty arrangements.
•2009 vs. 2008: For the years ended December 31, 2010 and 2009, adjusted EBITDA was $462,539 and
($136,298), respectively, an increase of 439%, or $598,837. The increase was primarily due to an increase of
4%, or $89,963, in revenues and a decrease of 20%, or $508,874, in expenses included in adjusted EBITDA.
The increase in revenue was primarily due to an increase in weighted average subscribers as well as
decreases in discounts on multi-subscription and internet packages, the introduction of the U.S. Music
Royalty Fee in the third quarter of 2009 and the sale of “Best of” programming, partially offset by decreased
equipment revenue. The decreases in expenses were primarily driven by lower subscriber acquisition costs,
lower sales and marketing discretionary spend, savings in programming and content expenses, and lower
legal and consulting costs in general and administrative expenses.
15