XM Radio 2010 Annual Report Download - page 68
Download and view the complete annual report
Please find page 68 of the 2010 XM Radio annual report below. You can navigate through the pages in the report by either clicking on the pages listed below, or by using the keyword search tool below to find specific information within the annual report.-
 1
1 -
2
-
3
-
4
-
5
-
6
-
7
-
8
-
9
-
10
-
11
-
12
-
13
-
14
-
15
-
16
-
17
-
18
-
19
-
20
-
21
-
22
-
23
-
24
-
25
-
26
-
27
-
28
-
29
-
30
-
31
-
32
-
33
-
34
-
35
-
36
-
37
-
38
-
39
-
40
-
41
-
42
-
43
-
44
-
45
-
46
-
47
-
48
-
49
-
50
-
51
-
52
-
53
-
54
-
55
-
56
-
57
-
 58
58 -
 59
59 -
 60
60 -
 61
61 -
 62
62 -
 63
63 -
 64
64 -
 65
65 -
 66
66 -
 67
67 -
 68
68 -
 69
69 -
 70
70 -
 71
71 -
 72
72 -
 73
73 -
 74
74 -
 75
75 -
 76
76 -
 77
77 -
 78
78 -
79
-
80
-
81
-
82
-
83
-
84
-
85
-
86
-
87
-
88
-
89
-
90
-
91
-
92
-
93
-
94
-
95
-
96
-
97
-
98
-
99
-
100
-
101
-
102
-
103
-
104
-
105
-
106
-
107
-
108
-
109
-
110
-
111
-
112
-
113
-
114
-
115
-
116
-
117
-
118
-
119
-
120
-
121
-
122
-
123
-
124
-
125
-
126
-
127
-
128
-
129
-
130
-
131
-
132
-
133
-
134
-
135
-
136
 |
 |

We believe investors use our current and projected adjusted EBITDA to estimate our current or prospective
enterprise value and to make investment decisions. By providing these Non-GAAP financial measures, together
with the reconciliations to the most directly comparable GAAP measure, we believe we are enhancing investors
understanding of our business and our results of operations. These Non-GAAP financial measures should be viewed
in addition to, and not as an alternative for or superior to, our reported results prepared in accordance with GAAP.
Please refer to the footnotes (pages 22 through 29) for a further discussion of such Non-GAAP financial measures
and reconciliations to the most directly comparable GAAP measure.
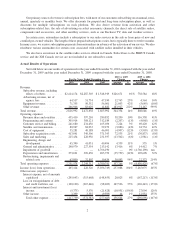
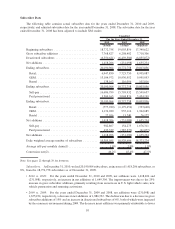
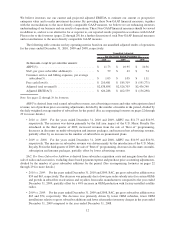
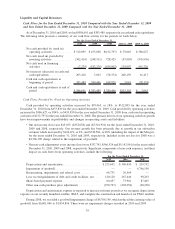
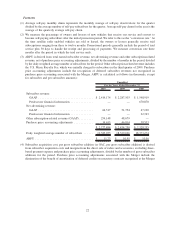
The following table contains our key operating metrics based on our unaudited adjusted results of operations
for the years ended December 31, 2010, 2009 and 2008, respectively:
2010 2009 2008
For the Years Ended December 31,
Unaudited Adjusted
(In thousands, except for per subscriber amounts)
ARPU(3) ................................... $ 11.73 $ 10.95 $ 10.56
SAC, per gross subscriber addition(4) .............. $ 59 $ 63 $ 74
Customer service and billing expenses, per average
subscriber(5)............................... $ 1.03 $ 1.05 $ 1.11
Free cash flow(6) ............................. $ 210,481 $ 185,319 $ (551,771)
Adjusted total revenue(8) ....................... $2,838,898 $2,526,703 $2,436,740
Adjusted EBITDA(7) .......................... $ 626,288 $ 462,539 $ (136,298)
Note: See pages 22 through 29 for footnotes.
ARPU is derived from total earned subscriber revenue, net advertising revenue and other subscription-related
revenue, net of purchase price accounting adjustments, divided by the number of months in the period, divided by
the daily weighted average number of subscribers for the period. (See accompanying footnotes on pages 22 through
29 for more details.)
•2010 vs. 2009: For the years ended December 31, 2010 and 2009, ARPU was $11.73 and $10.95,
respectively. The increase was driven primarily by the full year impact of the U.S. Music Royalty Fee
introduced in the third quarter of 2009, increased revenues from the sale of “Best of” programming,
decreases in discounts on multi-subscription and internet packages, and increased net advertising revenue,
partially offset by an increase in the number of subscribers on promotional plans.
•2009 vs. 2008: For the years ended December 31, 2009 and 2008, ARPU was $10.95 and $10.56,
respectively. The increase in subscriber revenue was driven mainly by the introduction of the U.S. Music
Royalty Fee in the third quarter of 2009, the sale of “Best of” programming, decreases in discounts on multi-
subscription and internet packages, partially offset by lower advertising revenue.
SAC, Per Gross Subscriber Addition is derived from subscriber acquisition costs and margins from the direct
sale of radios and accessories, excluding share-based payment expense and purchase price accounting adjustments,
divided by the number of gross subscriber additions for the period. (See accompanying footnotes on pages 22
through 29 for more details.)
•2010 vs. 2009: For the years ended December 31, 2010 and 2009, SAC, per gross subscriber addition was
$59 and $63, respectively. The decrease was primarily due to lower per radio subsidy rates for certain OEMs
and growth in subscriber reactivations and royalties from radio manufacturers compared to the year ended
December 31, 2009, partially offset by a 49% increase in OEM production with factory-installed satellite
radios.
•2009 vs. 2008: For the years ended December 31, 2009 and 2008, SAC, per gross subscriber addition was
$63 and $74, respectively. The decrease was primarily driven by lower OEM subsidies, fewer OEM
installations relative to gross subscriber additions and lower aftermarket inventory charges in the year ended
December 31, 2009 compared to the year ended December 31, 2008.
12