XM Radio 2010 Annual Report Download - page 63
Download and view the complete annual report
Please find page 63 of the 2010 XM Radio annual report below. You can navigate through the pages in the report by either clicking on the pages listed below, or by using the keyword search tool below to find specific information within the annual report.-
 1
1 -
2
-
3
-
4
-
5
-
6
-
7
-
8
-
9
-
10
-
11
-
12
-
13
-
14
-
15
-
16
-
17
-
18
-
19
-
20
-
21
-
22
-
23
-
24
-
25
-
26
-
27
-
28
-
29
-
30
-
31
-
32
-
33
-
34
-
35
-
36
-
37
-
38
-
39
-
40
-
41
-
42
-
43
-
44
-
45
-
46
-
47
-
48
-
49
-
50
-
51
-
52
-
 53
53 -
 54
54 -
 55
55 -
 56
56 -
 57
57 -
 58
58 -
 59
59 -
 60
60 -
 61
61 -
 62
62 -
 63
63 -
 64
64 -
 65
65 -
 66
66 -
 67
67 -
 68
68 -
 69
69 -
 70
70 -
 71
71 -
 72
72 -
 73
73 -
74
-
75
-
76
-
77
-
78
-
79
-
80
-
81
-
82
-
83
-
84
-
85
-
86
-
87
-
88
-
89
-
90
-
91
-
92
-
93
-
94
-
95
-
96
-
97
-
98
-
99
-
100
-
101
-
102
-
103
-
104
-
105
-
106
-
107
-
108
-
109
-
110
-
111
-
112
-
113
-
114
-
115
-
116
-
117
-
118
-
119
-
120
-
121
-
122
-
123
-
124
-
125
-
126
-
127
-
128
-
129
-
130
-
131
-
132
-
133
-
134
-
135
-
136
 |
 |
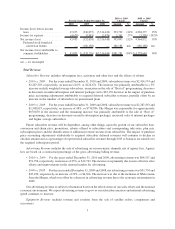
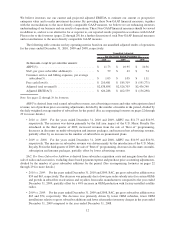
revenue. The decrease was primarily due to reductions in consumer advertising, event marketing and third
party distribution support expenses, partially offset by additional cooperative marketing and personnel costs.
•2009 vs. 2008: For the years ended December 31, 2009 and 2008, sales and marketing expenses were
$228,956 and $231,937, respectively, a decrease of 1%, or $2,981 and decreased as a percentage of total
revenue. The decrease was due to reductions in consumer advertising and cooperative marketing, personnel
costs and third party distribution support expenses, partially offset by the inclusion of XM’s sales and
marketing expense.
We expect sales and marketing expenses to increase as we increase advertising and promotional initiatives to
attract new subscribers in existing and new distribution channels, and launch and expand programs to retain our
subscribers.
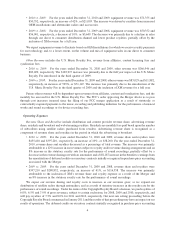
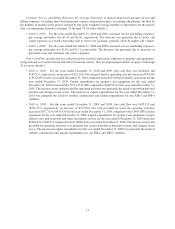
Engineering, Design and Development includes costs to develop chip sets and new products, research and
development for broadcast information systems and costs associated with the incorporation of our radios into
vehicles manufactured by automakers.
•2010 vs. 2009: For the years ended December 31, 2010 and 2009, engineering, design and development
expenses were $45,390 and $41,031, respectively, an increase of 11%, or $4,359 but remained flat as a
percentage of total revenue. The increase was primarily due to higher personnel, overhead and aftermarket
product development costs.
•2009 vs. 2008: For the years ended December 31, 2009 and 2008, engineering, design and development
expenses were $41,031 and $40,496, respectively, an increase of 1%, or $535 but decreased as a percentage
of total revenue. The increase was primarily due to the inclusion of XM’s engineering, design and
development expenses, partially offset by lower costs associated with development, tooling and testing
of radios as well as lower personnel costs.
We expect engineering, design and development expenses to increase in future periods as we develop our next
generation chip sets and products.
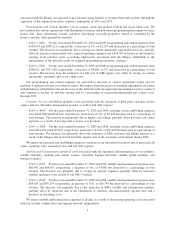
General and Administrative includes rent and occupancy, finance, legal, human resources, information
technology and investor relations costs.
•2010 vs. 2009: For the years ended December 31, 2010 and 2009, general and administrative expenses
were $240,970 and $227,554, respectively, an increase of 6%, or $13,416 but decreased as a percentage of
total revenue. The increase was primarily due to increased personnel and legal costs, partially offset by lower
share-based payment expense.
•2009 vs. 2008: For the years ended December 31, 2009 and 2008, general and administrative expenses
were $227,554 and $213,142, respectively, an increase of 7%, or $14,412 but decreased as a percentage of
total revenue. The increase was primarily due to the impact of the Merger, offset by lower costs for certain
merger, litigation and regulatory matters.
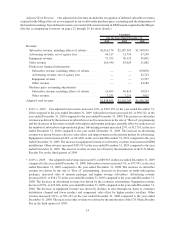
We expect our general and administrative expenses to increase in future periods primarily as a result of
increased information technology and personnel costs to support the growth of our business, as well as rising legal
costs.
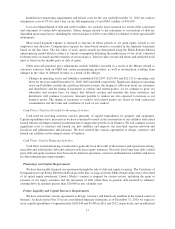
Impairment of Goodwill is recorded when the carrying value of goodwill exceeds the implied fair value of
goodwill.
•2010 vs. 2009: For the years ended December 31, 2010 and 2009, we did not record any impairment of
goodwill.
•2009 vs. 2008: For the years ended December 31, 2009 and 2008, impairment of goodwill was $0 and
$4,766,190, respectively.
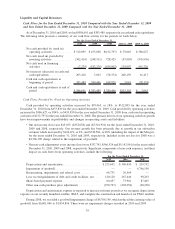
Depreciation and Amortization represents the systematic recognition in earnings of the acquisition cost of
assets used in operations, including our satellite constellations, property, equipment and intangible assets, over their
estimated service lives.
7