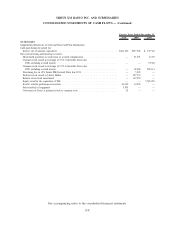
XM Radio 2010 Annual Report Download - page 92
Download and view the complete annual report
Please find page 92 of the 2010 XM Radio annual report below. You can navigate through the pages in the report by either clicking on the pages listed below, or by using the keyword search tool below to find specific information within the annual report.-
 1
1 -
2
-
3
-
4
-
5
-
6
-
7
-
8
-
9
-
10
-
11
-
12
-
13
-
14
-
15
-
16
-
17
-
18
-
19
-
20
-
21
-
22
-
23
-
24
-
25
-
26
-
27
-
28
-
29
-
30
-
31
-
32
-
33
-
34
-
35
-
36
-
37
-
38
-
39
-
40
-
41
-
42
-
43
-
44
-
45
-
46
-
47
-
48
-
49
-
50
-
51
-
52
-
53
-
54
-
55
-
56
-
57
-
58
-
59
-
60
-
61
-
62
-
63
-
64
-
65
-
66
-
67
-
68
-
69
-
70
-
71
-
72
-
73
-
74
-
75
-
76
-
77
-
78
-
79
-
80
-
81
-
 82
82 -
 83
83 -
 84
84 -
 85
85 -
 86
86 -
 87
87 -
 88
88 -
 89
89 -
 90
90 -
 91
91 -
 92
92 -
 93
93 -
 94
94 -
 95
95 -
 96
96 -
 97
97 -
 98
98 -
 99
99 -
 100
100 -
 101
101 -
 102
102 -
103
-
104
-
105
-
106
-
107
-
108
-
109
-
110
-
111
-
112
-
113
-
114
-
115
-
116
-
117
-
118
-
119
-
120
-
121
-
122
-
123
-
124
-
125
-
126
-
127
-
128
-
129
-
130
-
131
-
132
-
133
-
134
-
135
-
136
 |
 |

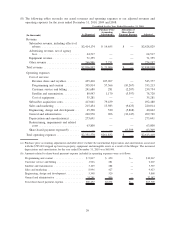
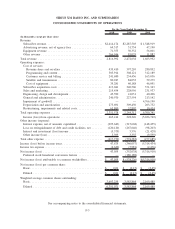
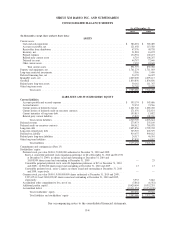
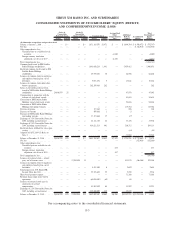
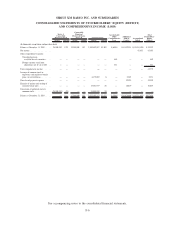
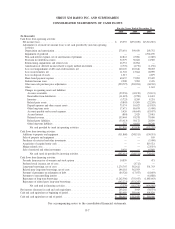
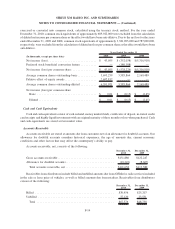
SIRIUS XM RADIO INC. AND SUBSIDIARIES
CONSOLIDATED BALANCE SHEETS
2010 2009
As of December 31,
(In thousands, except share and per share data)
ASSETS
Current assets:
Cash and cash equivalents . .................................................. $ 586,691 $ 383,489
Accounts receivable, net. . . .................................................. 121,658 113,580
Receivables from distributors ................................................. 67,576 48,738
Inventory, net ............................................................ 21,918 16,193
Prepaid expenses . . ....................................................... 134,994 100,273
Related party current assets .................................................. 6,719 106,247
Deferred tax asset . . ....................................................... 44,787 72,640
Other current assets. ....................................................... 7,432 18,620
Total current assets . . . .................................................. 991,775 859,780
Property and equipment, net . . .................................................. 1,761,274 1,711,003
Long-term restricted investments ................................................. 3,396 3,400
Deferred financing fees, net . . .................................................. 54,135 66,407
Intangible assets, net . ....................................................... 2,629,200 2,695,115
Goodwill ................................................................ 1,834,856 1,834,856
Related party long-term assets .................................................. 30,162 111,767
Other long-term assets ....................................................... 78,288 39,878
Total assets . ....................................................... $ 7,383,086 $ 7,322,206
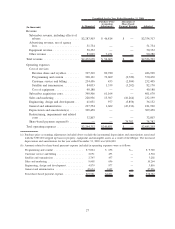
LIABILITIES AND STOCKHOLDERS’ EQUITY
Current liabilities:
Accounts payable and accrued expenses . . ........................................ $ 593,174 $ 543,686
Accrued interest . . . ....................................................... 72,453 74,566
Current portion of deferred revenue ............................................. 1,201,346 1,083,430
Current portion of deferred credit on executory contracts . .............................. 271,076 252,831
Current maturities of long-term debt ............................................. 195,815 13,882
Related party current liabilities . . . ............................................. 15,845 108,246
Total current liabilities ................................................. 2,349,709 2,076,641
Deferred revenue ........................................................... 273,973 255,149
Deferred credit on executory contracts ............................................. 508,012 784,078
Long-term debt ............................................................ 2,695,856 2,799,702
Long-term related party debt . .................................................. 325,907 263,579
Deferred tax liability . ....................................................... 914,637 940,182
Related party long-term liabilities . . . ............................................. 24,517 46,301
Other long-term liabilities . . . .................................................. 82,839 61,052
Total liabilities ...................................................... 7,175,450 7,226,684
Commitments and contingencies (Note 15)
Stockholders’ equity:
Preferred stock, par value $0.001; 50,000,000 authorized at December 31, 2010 and 2009:
Series A convertible preferred stock (liquidation preference of $0 at December 31, 2010 and $51,370
at December 31, 2009); no shares issued and outstanding at December 31, 2010 and
24,808,959 shares issued and outstanding at December 31, 2009 . . . .................... — 25
Convertible perpetual preferred stock, series B (liquidation preference of $13 at December 31, 2010
and 2009); 12,500,000 shares issued and outstanding at December 31, 2010 and 2009 ......... 13 13
Convertible preferred stock, series C junior; no shares issued and outstanding at December 31, 2010
and 2009, respectively . .................................................. — —
Common stock, par value $0.001; 9,000,000,000 shares authorized at December 31, 2010 and 2009;
3,933,195,112 and 3,882,659,087 shares issued and outstanding at December 31, 2010 and 2009,
respectively ........................................................... 3,933 3,882
Accumulated other comprehensive loss, net of tax . ................................... (5,861) (6,581)
Additional paid-in capital . . .................................................. 10,420,604 10,352,291
Accumulated deficit ....................................................... (10,211,053) (10,254,108)
Total stockholders’ equity . . ............................................. 207,636 95,522
Total liabilities and stockholders’ equity . . ................................... $ 7,383,086 $ 7,322,206
See accompanying notes to the consolidated financial statements.
F-4