XM Radio 2010 Annual Report Download - page 67
Download and view the complete annual report
Please find page 67 of the 2010 XM Radio annual report below. You can navigate through the pages in the report by either clicking on the pages listed below, or by using the keyword search tool below to find specific information within the annual report.-
 1
1 -
2
-
3
-
4
-
5
-
6
-
7
-
8
-
9
-
10
-
11
-
12
-
13
-
14
-
15
-
16
-
17
-
18
-
19
-
20
-
21
-
22
-
23
-
24
-
25
-
26
-
27
-
28
-
29
-
30
-
31
-
32
-
33
-
34
-
35
-
36
-
37
-
38
-
39
-
40
-
41
-
42
-
43
-
44
-
45
-
46
-
47
-
48
-
49
-
50
-
51
-
52
-
53
-
54
-
55
-
56
-
 57
57 -
 58
58 -
 59
59 -
 60
60 -
 61
61 -
 62
62 -
 63
63 -
 64
64 -
 65
65 -
 66
66 -
 67
67 -
 68
68 -
 69
69 -
 70
70 -
 71
71 -
 72
72 -
 73
73 -
 74
74 -
 75
75 -
 76
76 -
 77
77 -
78
-
79
-
80
-
81
-
82
-
83
-
84
-
85
-
86
-
87
-
88
-
89
-
90
-
91
-
92
-
93
-
94
-
95
-
96
-
97
-
98
-
99
-
100
-
101
-
102
-
103
-
104
-
105
-
106
-
107
-
108
-
109
-
110
-
111
-
112
-
113
-
114
-
115
-
116
-
117
-
118
-
119
-
120
-
121
-
122
-
123
-
124
-
125
-
126
-
127
-
128
-
129
-
130
-
131
-
132
-
133
-
134
-
135
-
136
 |
 |
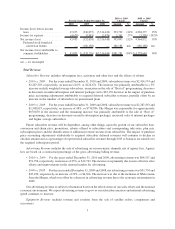
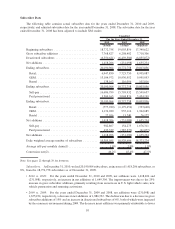
paid promotional trials due to the decline in North American auto sales and an increase in the average self-
pay monthly churn rate from 1.8% in 2008 to 2.0% in 2009.
Average Self-pay Monthly Churn is derived by dividing the monthly average of self-pay deactivations for the
quarter by the average self-pay subscriber balance for the quarter. (See accompanying footnotes on pages 22
through 29 for more details.)
•2010 vs. 2009: For the years ended December 31, 2010 and 2009, our average self-pay monthly churn rate
was 1.9% and 2.0%, respectively. The decrease was due to an improving economy, the success of retention
and win-back programs and reductions in non-pay cancellation rates.
•2009 vs. 2008: For the years ended December 31, 2009 and 2008, our average self-pay monthly churn rate
was 2.0% and 1.8%, respectively. The increase was due to the economic environment during 2009 which
drove reductions in consumer discretionary spending, combined with subscriber response to our decreases in
discounts on multi-subscription and internet packages, channel line-up changes in 2008 and the introduction
of the U.S. Music Royalty Fee in the third quarter of 2009.
Conversion Rate is the percentage of owners and lessees of new vehicles that receive our service and convert to
become self-paying subscribers after an initial promotional period. (See accompanying footnotes on pages 22
through 29 for more details.)
•2010 vs. 2009: For the years ended December 31, 2010 and 2009, our conversion rate was 46.2% and
45.4%, respectively. The increase was primarily due to marketing to promotional period subscribers and an
improving economy.
•2009 vs. 2008: For the years ended December 31, 2009 and 2008, our conversion rate was 45.4% and
47.5%, respectively. The decrease was primarily due to a reduction in consumer discretionary spending
resulting from the economic environment during 2009.
The discussion of operating results below excludes the effects of stock-based compensation and purchase price
accounting adjustments associated with the Merger. Financial measures and metrics previously reported as “pro
forma” have been renamed “adjusted.”
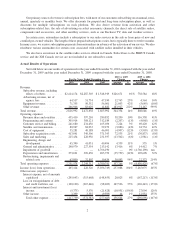
Adjusted Results of Operations
In this section, we present certain financial performance measures that are not calculated and presented in
accordance with generally accepted accounting principles in the United States of America (“Non-GAAP”). These
Non-GAAP financial measures include: average monthly revenue per subscriber, or ARPU; subscriber acquisition
cost, or SAC, per gross subscriber addition; customer service and billing expenses, per average subscriber; free cash
flow; adjusted total revenue; and adjusted EBITDA. These measures include the historical results of operations of
XM and exclude the impact of certain purchase price accounting adjustments. We use these Non-GAAP financial
measures to manage our business, set operational goals and as a basis for determining performance-based
compensation for our employees.
The purchase price accounting adjustments include the elimination of the earnings benefit of deferred revenue
associated with the investment in XM Canada, the recognition of subscriber revenues not recognized in purchase
price accounting and the elimination of the earnings benefit of deferred credits on executory contracts, which are
primarily attributable to third party arrangements with an OEM and programming providers.
Our adjusted EBITDA also reallocates share-based payment expense from functional operating expense line
items to a separate line within operating expenses. We believe the exclusion of share-based payment expense from
functional operating expenses is useful given the significant variation in expense that can result from changes in the
fair market value of our common stock, the effect of which is unrelated to the operational conditions that give rise to
variations in the components of our operating costs.
We believe these Non-GAAP financial measures provide useful information to investors regarding our
financial condition and results of operations. We believe investors find these Non-GAAP financial performance
measures useful in evaluating our core trends because it provides a direct view of our underlying contractual costs.
11