XM Radio 2010 Annual Report Download - page 81
Download and view the complete annual report
Please find page 81 of the 2010 XM Radio annual report below. You can navigate through the pages in the report by either clicking on the pages listed below, or by using the keyword search tool below to find specific information within the annual report.-
 1
1 -
2
-
3
-
4
-
5
-
6
-
7
-
8
-
9
-
10
-
11
-
12
-
13
-
14
-
15
-
16
-
17
-
18
-
19
-
20
-
21
-
22
-
23
-
24
-
25
-
26
-
27
-
28
-
29
-
30
-
31
-
32
-
33
-
34
-
35
-
36
-
37
-
38
-
39
-
40
-
41
-
42
-
43
-
44
-
45
-
46
-
47
-
48
-
49
-
50
-
51
-
52
-
53
-
54
-
55
-
56
-
57
-
58
-
59
-
60
-
61
-
62
-
63
-
64
-
65
-
66
-
67
-
68
-
69
-
70
-
 71
71 -
 72
72 -
 73
73 -
 74
74 -
 75
75 -
 76
76 -
 77
77 -
 78
78 -
 79
79 -
 80
80 -
 81
81 -
 82
82 -
 83
83 -
 84
84 -
 85
85 -
 86
86 -
 87
87 -
 88
88 -
 89
89 -
 90
90 -
 91
91 -
92
-
93
-
94
-
95
-
96
-
97
-
98
-
99
-
100
-
101
-
102
-
103
-
104
-
105
-
106
-
107
-
108
-
109
-
110
-
111
-
112
-
113
-
114
-
115
-
116
-
117
-
118
-
119
-
120
-
121
-
122
-
123
-
124
-
125
-
126
-
127
-
128
-
129
-
130
-
131
-
132
-
133
-
134
-
135
-
136
 |
 |

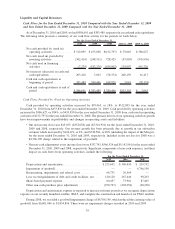
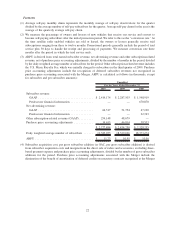
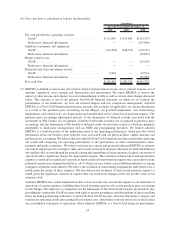
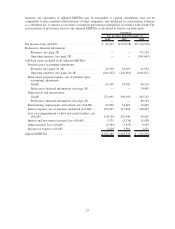
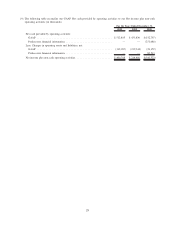
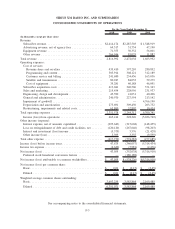
measure, our calculation of adjusted EBITDA may be susceptible to varying calculations; may not be
comparable to other similarly titled measures of other companies; and should not be considered in isolation,
as a substitute for, or superior to measures of financial performance prepared in accordance with GAAP. The
reconciliation of net income (loss) to the adjusted EBITDA is calculated as follows (in thousands):
2010 2009 2008
For the Years Ended December 31,
Unaudited
Net income (loss) (GAAP): . ........................ $ 43,055 $(352,038) $(5,316,910)
Predecessor financial information:
Revenues (see page 28) ........................ — — 731,194
Operating expenses (see page 28) ................. — — (961,663)
Add back items excluded from Adjusted EBITDA:
Purchase price accounting adjustments:
Revenues (see pages 26-28) ..................... 21,906 54,065 41,554
Operating expenses (see pages 26-28) .............. (261,832) (240,891) 4,661,812
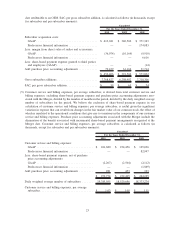
Share-based payment expense, net of purchase price
accounting adjustments:
GAAP ..................................... 63,309 78,782 90,134
Predecessor financial information (see page 28)....... — — 34,485
Depreciation and amortization:
GAAP ..................................... 273,691 309,450 203,752
Predecessor financial information (see page 28)....... — — 88,749
Restructuring, impairments and related costs (GAAP) .... 63,800 32,807 10,434
Interest expense, net of amounts capitalized (GAAP) .... 295,643 315,668 148,455
Loss on extinguishment of debt and credit facilities, net
(GAAP) .................................... 120,120 267,646 98,203
Interest and investment (income) loss (GAAP) ......... 5,375 (5,576) 21,428
Other (income) loss (GAAP) ...................... (3,399) (3,355) 9,599
Income tax expense (GAAP) ...................... 4,620 5,981 2,476
Adjusted EBITDA ................................ $626,288 $ 462,539 $ (136,298)
25