XM Radio 2010 Annual Report Download - page 66
Download and view the complete annual report
Please find page 66 of the 2010 XM Radio annual report below. You can navigate through the pages in the report by either clicking on the pages listed below, or by using the keyword search tool below to find specific information within the annual report.-
 1
1 -
2
-
3
-
4
-
5
-
6
-
7
-
8
-
9
-
10
-
11
-
12
-
13
-
14
-
15
-
16
-
17
-
18
-
19
-
20
-
21
-
22
-
23
-
24
-
25
-
26
-
27
-
28
-
29
-
30
-
31
-
32
-
33
-
34
-
35
-
36
-
37
-
38
-
39
-
40
-
41
-
42
-
43
-
44
-
45
-
46
-
47
-
48
-
49
-
50
-
51
-
52
-
53
-
54
-
55
-
 56
56 -
 57
57 -
 58
58 -
 59
59 -
 60
60 -
 61
61 -
 62
62 -
 63
63 -
 64
64 -
 65
65 -
 66
66 -
 67
67 -
 68
68 -
 69
69 -
 70
70 -
 71
71 -
 72
72 -
 73
73 -
 74
74 -
 75
75 -
 76
76 -
77
-
78
-
79
-
80
-
81
-
82
-
83
-
84
-
85
-
86
-
87
-
88
-
89
-
90
-
91
-
92
-
93
-
94
-
95
-
96
-
97
-
98
-
99
-
100
-
101
-
102
-
103
-
104
-
105
-
106
-
107
-
108
-
109
-
110
-
111
-
112
-
113
-
114
-
115
-
116
-
117
-
118
-
119
-
120
-
121
-
122
-
123
-
124
-
125
-
126
-
127
-
128
-
129
-
130
-
131
-
132
-
133
-
134
-
135
-
136
 |
 |

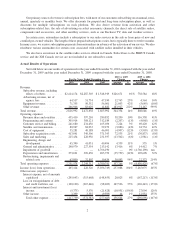
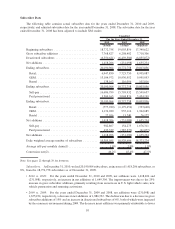
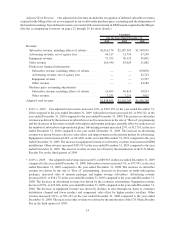
Subscriber Data
The following table contains actual subscriber data for the years ended December 31, 2010 and 2009,
respectively, and adjusted subscriber data for the year ended December 31, 2008. The subscriber data for the year
ended December 31, 2008 has been adjusted to include XM results:
2010 2009 2008
For the Years Ended December 31,
Unaudited
(Actual) (Actual) (Adjusted)
Beginning subscribers ........................... 18,772,758 19,003,856 17,348,622
Gross subscriber additions ........................ 7,768,827 6,208,482 7,710,306
Deactivated subscribers .......................... (6,350,621) (6,439,580) (6,055,072)
Net additions .................................. 1,418,206 (231,098) 1,655,234
Ending subscribers .............................. 20,190,964 18,772,758 19,003,856
Retail...................................... 6,947,830 7,725,750 8,905,087
OEM...................................... 13,104,972 10,930,952 9,995,953
Rental ..................................... 138,162 116,056 102,816
Ending subscribers .............................. 20,190,964 18,772,758 19,003,856
Self-pay .................................... 16,686,799 15,703,932 15,549,657
Paid promotional ............................. 3,504,165 3,068,826 3,454,199
Ending subscribers .............................. 20,190,964 18,772,758 19,003,856
Retail...................................... (777,920) (1,179,452) (333,628)
OEM...................................... 2,174,020 935,114 1,962,685
Rental ..................................... 22,106 13,240 26,177
Net additions .................................. 1,418,206 (231,098) 1,655,234
Self-pay .................................... 982,867 154,275 1,676,311
Paid promotional ............................. 435,339 (385,373) (21,077)
Net additions .................................. 1,418,206 (231,098) 1,655,234
Daily weighted average number of subscribers ......... 19,385,055 18,529,696 18,373,274
Average self-pay monthly churn(1) . . . ............... 1.9% 2.0% 1.8%
Conversion rate(2) .............................. 46.2% 45.4% 47.5%
Note: See pages 22 through 29 for footnotes.
Subscribers. At December 31, 2010, we had 20,190,964 subscribers, an increase of 1,418,206 subscribers, or
8%, from the 18,772,758 subscribers as of December 31, 2009.
•2010 vs. 2009: For the years ended December 31, 2010 and 2009, net additions were 1,418,206 and
(231,098), respectively, an increase in net additions of 1,649,304. The improvement was due to the 25%
increase in gross subscriber additions, primarily resulting from an increase in U.S. light vehicle sales, new
vehicle penetration and returning activations.
•2009 vs. 2008: For the years ended December 31, 2009 and 2008, net additions were (231,098) and
1,655,234, respectively, a decrease in net additions of 1,886,332. The decline was due to a decrease in gross
subscriber additions of 19% and an increase in deactivated subscribers of 6%, both of which were impacted
by the economic environment during 2009. The decrease in net additions was primarily attributable to fewer
10