Vonage 2010 Annual Report Download - page 71
Download and view the complete annual report
Please find page 71 of the 2010 Vonage annual report below. You can navigate through the pages in the report by either clicking on the pages listed below, or by using the keyword search tool below to find specific information within the annual report.-
 1
1 -
2
-
3
-
4
-
5
-
6
-
7
-
8
-
9
-
10
-
11
-
12
-
13
-
14
-
15
-
16
-
17
-
18
-
19
-
20
-
21
-
22
-
23
-
24
-
25
-
26
-
27
-
28
-
29
-
30
-
31
-
32
-
33
-
34
-
35
-
36
-
37
-
38
-
39
-
40
-
41
-
42
-
43
-
44
-
45
-
46
-
47
-
48
-
49
-
50
-
51
-
52
-
53
-
54
-
55
-
56
-
57
-
58
-
59
-
60
-
 61
61 -
 62
62 -
 63
63 -
 64
64 -
 65
65 -
 66
66 -
 67
67 -
 68
68 -
 69
69 -
 70
70 -
 71
71 -
 72
72 -
 73
73 -
 74
74 -
 75
75 -
 76
76 -
 77
77 -
 78
78 -
 79
79 -
 80
80 -
 81
81 -
82
-
83
-
84
-
85
-
86
-
87
-
88
-
89
-
90
-
91
-
92
-
93
-
94
-
95
-
96
-
97
 |
 |

V
O
NA
G
EH
O
LDIN
GS CO
RP
.
N
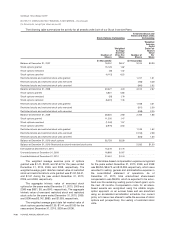
OTES TO CONSOLIDATED FINANCIAL STATEMENTS—(Continued)
(
In thousands, except per share amounts
)
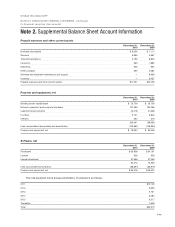
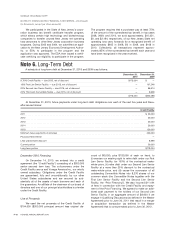
D
eprec
i
at
i
on an
d
amort
i
zat
i
on expense
D
ecem
b
er
3
1
,
20
1
0
D
ecem
b
er
3
1
,
2009
D
ecem
b
er
3
1
,
2008
Network equipment and computer hardware $20,887 $21,698 $21,64
7
S
oftware 22
,
602 19
,
418 11
,
85
8
Capital lease
s
2,
199 2
,
199 2
,
199
O
ther leasehold improvements 3,679 3,685 3,760
F
urn
i
ture 1
,
827 2
,
061 2
,
409
V
e
hi
c
l
es
1
5997
Di
sp
l
a
y
s
—
48 161
P
atents 1
,
145 1
,
319 2
,
81
5
52
,
3
5
4
5
0
,
43
7
44
,
946
Property and equipment impairments 584 1,886 1,762
S
oftware im
p
airments
13
5
1
,
068 1
,
904
Depreciation and amortization expense $53,073 $53,391 $48,61
2
A
mount
i
nc
l
u
d
e
di
n
i
nterest expens
e
D
ecem
b
er
3
1
,
20
1
0
D
ecem
b
er
3
1
,
2009
D
ecem
b
er
3
1
,
2008
D
ebt related costs amortization $1
,
402 $2
,
708 $3
,
237
Amount included in other income
(
expense
)
, net
D
ecem
b
er
3
1
,
20
1
0
D
ecem
b
er
3
1
,
2009
D
ecem
b
er
3
1
,
2008
Net gains (losses) resulting from foreign exchange transactions $(19) $46 $(315
)
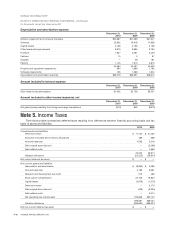
Note 5.
I
n
co
m
e
T
a
x
es
T
he following table summarizes deferred taxes resulting from differences between financial accounting basis and ta
x
bas
i
so
f
asse
t
sa
n
d
li
ab
iliti
es.
20
1
0 2009
C
urrent assets and liabilities:
De
f
erred revenue
$
17
,
150 $ 21
,
45
0
A
ccounts rece
i
va
bl
ean
di
nventor
y
a
ll
owance
s
489 688
A
ccrue
d
expenses 4
,
583 5
,
218
D
e
b
tor
i
g
i
na
li
ssue
di
scoun
t
— (2,098
)
D
e
b
tre
l
ate
d
cost
s
—1
,
65
6
22
,
222 26
,
914
V
a
l
ua
ti
o
n
a
ll
o
w
a
n
ce
(
22,222
)(
26,914
)
Net current de
f
erred tax asse
t
$
—
$
—
N
on-current assets an
dli
a
bili
t
i
es
:
De
p
reciation and amortizatio
n
$(
8,332
)$
2,089
A
ccrued ex
p
enses
4
,7
89
5,5
67
Research and develo
p
ment tax credit
519 469
S
tock o
p
tion com
p
ensatio
n
22
,
1
5
319
,
820
C
a
p
ital lease
s
(
1,878
)(
1,275
)
D
e
f
e
rr
ed
r
e
v
e
n
ue
—
3
,
1
7
3
Debt ori
g
inal issue discoun
t
(
426
)(
6,934
)
D
eb
tr
e
l
a
t
ed cos
t
s
—
6
,
014
N
et operatin
g
loss carryforwar
d
3
7
6
,
8
5
6 330
,
104
393
,
681 3
5
9
,
027
V
a
l
uat
i
on a
ll
owance
(
393,681) (359,027
)
N
et non-current de
f
erred tax asse
t
$
—
$
—
F-16
VO
NA
G
E ANN
U
AL REP
O
RT 2010