Vonage 2010 Annual Report Download - page 34
Download and view the complete annual report
Please find page 34 of the 2010 Vonage annual report below. You can navigate through the pages in the report by either clicking on the pages listed below, or by using the keyword search tool below to find specific information within the annual report.-
 1
1 -
2
-
3
-
4
-
5
-
6
-
7
-
8
-
9
-
10
-
11
-
12
-
13
-
14
-
15
-
16
-
17
-
18
-
19
-
20
-
21
-
22
-
23
-
 24
24 -
 25
25 -
 26
26 -
 27
27 -
 28
28 -
 29
29 -
 30
30 -
 31
31 -
 32
32 -
 33
33 -
 34
34 -
 35
35 -
 36
36 -
 37
37 -
 38
38 -
 39
39 -
 40
40 -
 41
41 -
 42
42 -
 43
43 -
 44
44 -
45
-
46
-
47
-
48
-
49
-
50
-
51
-
52
-
53
-
54
-
55
-
56
-
57
-
58
-
59
-
60
-
61
-
62
-
63
-
64
-
65
-
66
-
67
-
68
-
69
-
70
-
71
-
72
-
73
-
74
-
75
-
76
-
77
-
78
-
79
-
80
-
81
-
82
-
83
-
84
-
85
-
86
-
87
-
88
-
89
-
90
-
91
-
92
-
93
-
94
-
95
-
96
-
97
 |
 |
M
ost tra
di
t
i
ona
l
w
i
re
li
ne an
d
w
i
re
l
ess te
l
ep
h
one serv
i
ce prov
id
er
s
and cable companies are substantially lar
g
er and better cap-
italized than we are and have the advanta
g
e of a lar
g
e existin
g
customer base. In addition, because our com
p
etitors
p
rovid
e
other services, they often choose to offer VoIP services or other
v
oice services as
p
art of a bundle that includes other
p
roducts,
s
uch as video, hi
g
h speed Internet access, and wireless telephon
e
s
ervice, which we do not o
ff
er. Further, as wireless
p
roviders o
ff
e
r
more minutes at lower prices, better covera
g
e, and companion
landline alternative services, their services have become mor
e
attractive to households as a re
p
lacement
f
or wire line service. We
also compete a
g
ainst alternative voice communication providers
,
s
uch as Skype, Goo
g
le Voice, ma
g
icJack, and independent VoI
P
s
ervice
p
roviders. Some of these service
p
roviders have chose
n
to sacri
f
ice telephony revenue in order to
g
ain market share an
d
have o
ff
ered their services at low
p
rices or
f
or
f
ree. As we con-
tinue to introduce applications that inte
g
rate di
ff
erent
f
orms o
f
v
oice and messa
g
in
g
services over multiple devices, we are likel
y
to
f
ace competition
f
rom emer
g
in
g
competitors
f
ocused on simila
r
inte
g
ration, as well as
f
rom established alternative voic
e
communication
p
roviders. In addition, our com
p
etitors have
p
art
-
nered and may in the
f
uture partner with other competitors t
o
o
ff
er products and services, levera
g
in
g
their collective competitiv
e
p
ositions. We also are sub
j
ect to the risk o
ff
uture disru
p
tiv
e
tec
h
no
l
o
gi
es
.
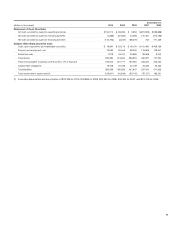
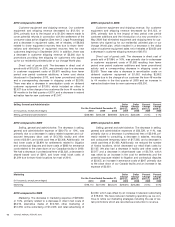
G
ross subscriber line additions
.
G
ross subscriber line addi
-
tions
f
or a particular period are calculated by takin
g
the net sub-
s
criber line additions durin
g
that particular period and addin
g
to
that the number o
f
subscriber lines that terminated durin
g
tha
t
p
eriod. This number does not include subscriber lines both added
a
nd terminated durin
g
the period, where termination occurre
d
w
ithin the
f
irst 30 days a
f
ter activation. The number does include,
h
owever, su
b
scr
ib
er
li
nes a
dd
e
dd
ur
i
n
g
t
h
e per
i
o
d
t
h
at are term
i
-
nated within 30 da
y
so
f
activation but a
f
ter the end o
f
the period
.
N
e
t
subsc
ri
be
r lin
e add
iti
o
n
s.
N
e
t
subsc
ri
be
r lin
e add
iti
o
n
sfo
r
a
p
articular
p
eriod re
f
lect the number o
f
subscriber lines at th
e
end o
f
the
p
eriod, less the number o
f
subscriber lines at th
e
be
g
innin
g
o
f
the period
.
Subscriber lines.
O
ur subscriber lines include, as of a partic-
u
lar date
,
all subscriber lines
f
rom which a customer can make an
outbound telephone call on that date.
O
ur subscriber lines includ
e
f
ax lines and so
f
t phones but do not include our virtual phone
n
umbers or toll free numbers, which onl
y
allow inbound telephone
calls to customers.
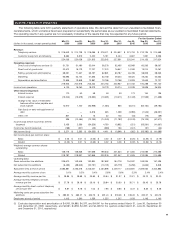
S
ubscriber lines decreased from 2
,
434
,
896 a
s
of December 31
,
2009 to 2
,
404
,
883 as of December 31
,
2010. In
t
he fourth quarter of 2010, we added 5,848 net subscriber lines.
We believe that the decrease in our subscriber lines for the
y
ea
r
w
as pr
i
mar
il
y
d
ue to
i
ncreas
i
ng w
i
re
l
ess su
b
st
i
tut
i
on, ot
h
er com
-
petition, particularl
y
from cable companies, and reduced market
-
i
ng spending. The increase in net subscriber lines in the fourt
h
quarter was primaril
y
due to further penetration of international
ca
lli
ng mar
k
ets an
d
sta
bl
ec
h
urn.
W
e expect more gross
li
nes
in
2011 compare
d
to 2010 an
d
pos
i
t
i
ve net su
b
scr
ib
er
li
nes
i
n 2011.
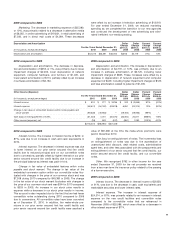
A
verage mont
hl
y customer c
h
urn
.
A
verage mont
hl
y customer
churn for a particular period is calculated by dividing the numbe
r
of customers that terminated during that period by the simpl
e
average number of customers during the period, and dividing the
r
esult by the number of months in the period. The simple average
number of customers during the period is the number of custom
-
ers on the first da
y
of the period, plus the number of customers
on the last da
y
of the period, divided b
y
two. Terminations, a
s
used in the calculation of churn statistics
,
do not include custom-
ers terminated during the period if termination occurred within the
first 30 days after activation.
O
ur average monthly customer churn
decreased to 2.4% in 2010 from 3.1% in 2009. In the fourth quar
-
t
er of 2010, our average monthly customer churn was 2.4%. W
e
b
e
li
eve t
h
ere
d
uct
i
on
i
nc
h
urn
i
s
d
ue to
i
n
i
t
i
at
i
ves to
i
mprove t
h
e
customer
’
s exper
i
ence,
i
nc
l
u
di
ng on-
b
oar
di
ng an
d
networ
k
qua
l
-
i
ty, an improving economy and credit profile for new customer
acqu
i
s
i
t
i
ons, w
hi
c
hh
as pos
i
t
i
ve
ly i
mpacte
d
non-pa
y
c
h
urn, an
d
t
he value proposition of the Vonage World offer. We monito
r
churn on a dail
y
basis and use it as an indicator of the level of
customer satisfaction.
O
ther companies ma
y
calculate churn dif
-
ferentl
y
, and their churn data ma
y
not be directl
y
comparable t
o
ours.
C
ustomers who have been with us for a
y
ear or more ten
d
t
o have a lower churn rate than customers who have not.
O
u
r
churn will fluctuate over time due to economic conditions
,
com-
p
etitive pressures includin
g
wireless substitution, market plac
e
p
erception of our services, and our ability to provide hi
g
h qualit
y
customer care and network quality and add future innovativ
e
p
roducts and services
.
Avera
g
e monthl
y
revenue per line. Avera
g
e monthly revenu
e
p
er line
f
or a particular period is calculated by dividin
g
our tota
l
r
evenue
f
or that period by the simple avera
g
e number o
f
sub
-
s
criber lines
f
or the period, and dividin
g
the result by the number
of
months in the period. The simple avera
g
e number o
f
subscriber
lines
f
or the
p
eriod is the number o
f
subscriber lines on the
f
irs
t
d
ay o
f
the period, plus the number o
f
subscriber lines on the las
t
d
ay of the period, divided by two. Our avera
g
e monthly revenue
p
er line increased to $30.48 for 2010 com
p
ared to $29.49 for
2009
.
A
vera
g
e monthl
y
telephon
y
services revenue per line.
A
vera
ge
monthly telephony services revenue per line
f
or a particular perio
d
is calculated by dividin
g
our total telephony services revenue
f
o
r
that period by the simple avera
g
e number o
f
subscriber lines
f
o
r
the period, and dividing the result by the number o
f
months in the
p
eriod. Our average monthly telephony services revenue per lin
e
w
as $30.06 for 2010 compared with $28.68 for 2009. Thi
s
increase was due to an increase in the number o
f
customers sign
-
ing up
f
or higher priced rate plans, selective pricing actions w
e
i
mp
l
emente
d
a
l
ong w
i
t
h
en
h
ancements to our serv
i
ce, an
d
i
mprove
d
customer qua
li
t
y
t
h
at re
d
uce
db
a
dd
e
b
t costs
.
A
verage monthly direct cost of telephony services pe
r
li
ne.
A
verage monthly direct cost of telephony services per line fo
r
a
particular period is calculated by dividing our direct cost of tel
-
e
phony services for that period by the simple average number o
f
s
ubscriber lines for the period, and dividing the result by th
e
number of months in the period. We use the average monthl
y
d
irect cost of telephon
y
services per line to evaluate how effectiv
e
w
e are at managing our costs of providing service.
O
ur averag
e
monthl
y
direct cost of telephon
y
services per line increased t
o
$
8.40 for 2010 compared to
$
7.08 for 2009, due primaril
y
t
o
higher costs from higher international call volume associated wit
h
V
onage World, partially offset by more favorable rates negotiated
w
ith our service providers. Direct cost of telephon
y
services both
o
vera
ll
an
d
on a per
li
ne
b
as
i
s
i
s expecte
d
to cont
i
nue to
i
ncreas
e
in 2011. The drivers of this increase are international calling by our
g
rowing base of Vonage World customers and potential regu
-
l
atory term
i
nat
i
on c
h
arges
i
n certa
i
n
hi
g
h
vo
l
ume countr
i
es.
27