Vonage 2010 Annual Report Download - page 38
Download and view the complete annual report
Please find page 38 of the 2010 Vonage annual report below. You can navigate through the pages in the report by either clicking on the pages listed below, or by using the keyword search tool below to find specific information within the annual report.-
 1
1 -
2
-
3
-
4
-
5
-
6
-
7
-
8
-
9
-
10
-
11
-
12
-
13
-
14
-
15
-
16
-
17
-
18
-
19
-
20
-
21
-
22
-
23
-
24
-
25
-
26
-
27
-
 28
28 -
 29
29 -
 30
30 -
 31
31 -
 32
32 -
 33
33 -
 34
34 -
 35
35 -
 36
36 -
 37
37 -
 38
38 -
 39
39 -
 40
40 -
 41
41 -
 42
42 -
 43
43 -
 44
44 -
 45
45 -
 46
46 -
 47
47 -
 48
48 -
49
-
50
-
51
-
52
-
53
-
54
-
55
-
56
-
57
-
58
-
59
-
60
-
61
-
62
-
63
-
64
-
65
-
66
-
67
-
68
-
69
-
70
-
71
-
72
-
73
-
74
-
75
-
76
-
77
-
78
-
79
-
80
-
81
-
82
-
83
-
84
-
85
-
86
-
87
-
88
-
89
-
90
-
91
-
92
-
93
-
94
-
95
-
96
-
97
 |
 |

S
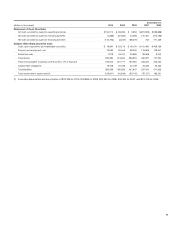
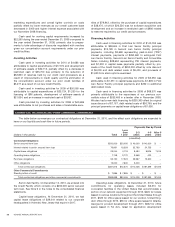
ummary of Results for the Years Ended December 31, 2010, 2009, and 200
8
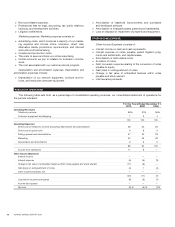
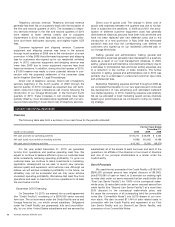
Telephony Services Revenue and Direct Cost of Services
F
or t
h
e
Y
ears
E
n
d
e
dD
ecem
b
er
3
1
,
D
o
ll
a
r
C
hange
2
010` vs
.
2009
D
o
ll
ar
Chang
e
2009
vs.
2008
P
ercent
C
hange
20
1
0
vs
.
2009
P
ercent
Chang
e
2009
vs.
2008
(in thousands, except percentages
)
20
1
0 2009 2008
Telephon
y
services $872,934 $864,848 $865,765 $ 8,086 $ (917) 1% (0%)
Direct cost of telephony services (excluding depreciation and
amortization of
$
18,725,
$
18,958, and
$
20,254, respectively) 243,794 213,553 226,210 30,241 (12,657) 14% (6%)
20
1
0
compare
d
to
2009
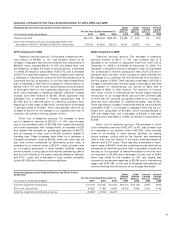
T
e
l
ep
h
ony serv
i
ces revenue.
Th
e
i
ncrease
i
nte
l
ep
h
on
y
serv
-
i
ces revenue of
$
8,086, or 1%, was primaril
y
driven b
y
a
n
i
ncrease in re
g
ulatory fees that we collected from subscribers of
$
38,605, which included
$
8,457 of USF and related fees, wit
h
t
he remainin
g
increase the result of pricin
g
actions, a decreas
e
i
n credits we issued to subscribers of
$
15,153, and a decreas
e
of
$
16,076 in bad debt expense. These increases were offset b
y
a decrease in international revenue of
$
18,500 primarily due to
customers movin
g
, as expected, to our
f
ixed rate Vona
g
e World
p
lan, a decrease in
f
ees that we char
g
ed
f
or disconnectin
g
our
s
ervice of $11,797 due to fewer disconnections and elimination
of termination fees for new customers be
g
innin
g
in September
2010, and a decrease in additional
f
eatures, domestic overa
g
e
char
g
es, and other revenue of $5,460. Fewer subscriber lines
t
ranslated into a decrease in monthly subscription
f
ees o
f
$
15,329 and our discontinuation of collectin
g
activation fees
,
b
e
g
innin
g
in most cases in May 2009, contributed to a decreas
e
i
n activation fees of $10,661, which was partially offset by a
n
i
ncrease of $3,014 for the chan
g
e in our customer life from 44
months to 38 months in the
f
irst
q
uarter o
f
2010
.
D
irect cost o
f
telephon
y
services
.
Th
e
in
c
r
ease
in
d
ir
ec
t
cost of telephony services of $30,241, or 14%, was primarily
due to the increased costs of $33,408 from hi
g
her international
call volume associated with Vona
g
e World, an increase of USF
and related fees imposed by government agencies of $8,279
,
and an increase in other cost of $1,663 primaril
y
related to
l
icensing
f
ees. These increases were o
ff
set by a decrease i
n
domestic termination costs of $9
,
222
,
which are costs that we
p
ay other phone companies
f
or terminating phone calls, a
decrease in our network costs of $2
,
261
,
which includes cost
s
f
or co-locating equipment in other carriers’
f
acilities, leasin
g
p
hone numbers, routing calls on the Internet, transferring calls to
and from the Internet to the public switched telephone network
,
an
dE
-911 costs, an
d
a
d
ecrease
i
n
l
oca
l
num
b
er porta
bili
t
y
costs of
$
1
,
626 due to fewer customer additions
.
2009
compare
d
to
2008
T
e
l
ep
h
ony serv
i
ces revenue.
Th
e
d
ecrease
i
nte
l
ep
h
on
y
s
ervices revenue of
$
917, or 0%, was primaril
y
due to
a
decrease in the number of subscriber lines from 2
,
607
,
156 a
t
December 31, 2008 to 2,434,896 at December 31, 2009. The
decrease in subscriber lines and chan
g
es in plan mix translated
i
nto a decrease in monthly subscription fees of
$
14,379 and i
n
activation fees of
$
1,830, which included an offset of
$
3,664 fo
r
t
he chan
g
e in our customer li
f
e
f
rom 48 months to 44 months i
n
t
he first
q
uarter of 2009. There was also a decrease of
$
1,046 i
n
overa
g
e in domestic plan minutes usa
g
e, a decrease in
f
ees that
we char
g
ed for disconnectin
g
our service of $555 and
a
decrease of $934 in other revenue. The reduction in revenue
f
rom lower volume o
f
international per minute usa
g
e
f
ollowin
g
i
ntroduction o
f
our Vona
g
e World plan with
f
ree unlimited call
s
t
o more than 60 countries, as partially o
ff
set by an increase i
n
r
evenues from customers on international
p
lans, was $1,765
.
T
here was also an increase in additional
f
eatures we
p
rovided t
o
customers of $571, an increase in re
g
ulatory fees that we col
-
l
ected from subscribers of $14,850, which included $3,392 o
f
U
SF and related fees, and a decrease of $2,300 in bad debt
ex
p
ense and a decrease in credits we issued to subscribers o
f
$
1,869
.
D
irect cost o
f
telephon
y
services.
The dec
r
ease i
n
di
r
ec
t
c
ost of telephon
y
services of $12,657, or 6%, was primaril
y
du
e
to a decrease in our network costs of $13
,
685
,
which includes
c
osts
f
or co-locating in other carriers’
f
acilities,
f
or leasing
p
hone numbers, routing calls on the Internet, and trans
f
errin
g
c
alls to and
f
rom the Internet to the public switched telephone
networ
k
an
dE
-911 costs.
Th
ere was a
l
so a
d
ecrease
i
n term
i-
nation costs of $8,293, which are costs that we pa
y
other phone
c
ompanies
f
or terminating phone calls, a decrease o
f
taxes that
we pa
y
on our purchase of telecommunications services fro
m
o
ur suppliers of
$
1,369 and a decrease in other cost of
$
184
,
which was offset b
y
the increase of U
S
F and related fee
s
imposed by government agencies of
$
3,392 and in internationa
l
usage cost of
$
7,482, in part due to increased international call
volume following the introduction of our Vonage World plan
.
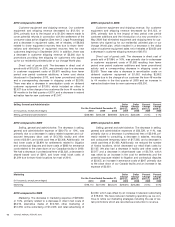
C
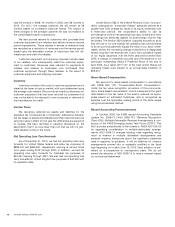
ustomer Equipment and
S
hipping Revenue and Direct
C
ost of
G
oods
S
old
F
or t
h
e
Y
ears
E
n
d
e
dD
ecem
b
er
3
1
,
D
o
ll
a
r
C
hange
20
1
0
vs
.
2009
D
o
ll
ar
Chang
e
2009
vs.
2008
P
ercent
C
hange
20
1
0
vs
.
2009
P
ercent
Chang
e
2009
vs.
2008
(in thousands, except percentages
)
20
1
0 2009 2008
C
ustomer equipment and shipping $ 12,108 $ 24,232 $ 34,355 $(12,124) $(10,123) (50%) (29%)
Direct cost of goods sold 55,965 71,488 79,382 (15,523) (7,894) (22%) (10%)
C
ustomer equipment and shippin
gg
ross loss
(
43,857
)(
47,256
)(
45,027
)
31