United Healthcare 2011 Annual Report Download - page 87
Download and view the complete annual report
Please find page 87 of the 2011 United Healthcare annual report below. You can navigate through the pages in the report by either clicking on the pages listed below, or by using the keyword search tool below to find specific information within the annual report.-
 1
1 -
2
-
3
-
4
-
5
-
6
-
7
-
8
-
9
-
10
-
11
-
12
-
13
-
14
-
15
-
16
-
17
-
18
-
19
-
20
-
21
-
22
-
23
-
24
-
25
-
26
-
27
-
28
-
29
-
30
-
31
-
32
-
33
-
34
-
35
-
36
-
37
-
38
-
39
-
40
-
41
-
42
-
43
-
44
-
45
-
46
-
47
-
48
-
49
-
50
-
51
-
52
-
53
-
54
-
55
-
56
-
57
-
58
-
59
-
60
-
61
-
62
-
63
-
64
-
65
-
66
-
67
-
68
-
69
-
70
-
71
-
72
-
73
-
74
-
75
-
76
-
 77
77 -
 78
78 -
 79
79 -
 80
80 -
 81
81 -
 82
82 -
 83
83 -
 84
84 -
 85
85 -
 86
86 -
 87
87 -
 88
88 -
 89
89 -
 90
90 -
 91
91 -
 92
92 -
 93
93 -
 94
94 -
 95
95 -
 96
96 -
 97
97 -
98
-
99
-
100
-
101
-
102
-
103
-
104
 |
 |

85
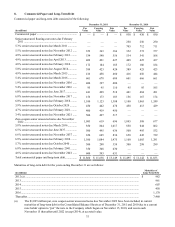
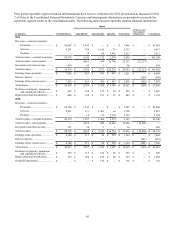
Prior period reportable segment financial information has been recast to conform to the 2011 presentation as discussed in Note
2 of Notes to the Consolidated Financial Statements. Corporate and intersegment eliminations are presented to reconcile the
reportable segment results to the consolidated results. The following table presents reportable segment financial information:
(in millions)
2011
Revenues - external customers:
Premiums ..................................
Services.....................................
Products.....................................
Total revenues - external customers..
Total revenues - intersegment...........
Investment and other income............
Total revenues...................................
Earnings from operations..................
Interest expense.................................
Earnings before income taxes ...........
Total Assets.......................................
Purchases of property, equipment
and capitalized software............
Depreciation and amortization..........
2010
Revenues - external customers:
Premiums ..................................
Services.....................................
Products.....................................
Total revenues - external customers..
Total revenues - intersegment...........
Investment and other income............
Total revenues...................................
Earnings from operations..................
Interest expense.................................
Earnings before income taxes ...........
Total Assets.......................................
Purchases of property, equipment
and capitalized software............
Depreciation and amortization..........
Goodwill impairment........................
UnitedHealthcare
$ 90,487
4,291
—
94,778
—
558
$ 95,336
$ 7,203
—
$ 7,203
$ 52,618
$ 635
$ 680
$ 84,158
4,021
—
88,179
—
551
$ 88,730
$ 6,740
—
$ 6,740
$ 50,913
$ 525
$ 725
$ —
Optum
OptumHealth
$ 1,496
628
24
2,148
4,461
95
$ 6,704
$ 423
—
$ 423
$ 6,756
$ 168
$ 154
$ 1,247
331
19
1,597
2,912
56
$ 4,565
$ 511
—
$ 511
$ 3,897
$ 117
$ 100
$ —
OptumInsight
$ —
1,616
96
1,712
958
1
$ 2,671
$ 381
—
$ 381
$ 5,308
$ 175
$ 195
$ —
1,403
93
1,496
845
1
$ 2,342
$ 84
—
$ 84
$ 5,435
$ 156
$ 159
$ 172
OptumRx
$ —
78
2,492
2,570
16,708
—
$19,278
$ 457
—
$ 457
$ 3,503
$ 89
$ 95
$ —
64
2,210
2,274
14,449
1
$16,724
$ 529
—
$ 529
$ 3,087
$ 80
$ 80
$ —
Total Optum
$ 1,496
2,322
2,612
6,430
22,127
96
$ 28,653
$ 1,261
—
$ 1,261
$ 15,567
$ 432
$ 444
$ 1,247
1,798
2,322
5,367
18,206
58
$ 23,631
$ 1,124
—
$ 1,124
$ 12,419
$ 353
$ 339
$ 172
Corporate and
Intersegment
Eliminations
$ —
—
—
—
(22,127)
—
$ (22,127)
$ —
(505)
$ (505)
$ (296)
$ —
$ —
$ —
—
—
—
(18,206)
—
$ (18,206)
$ —
(481)
$ (481)
$ (269)
$ —
$ —
$ —
Consolidated
$ 91,983
6,613
2,612
101,208
—
654
$ 101,862
$ 8,464
(505)
$ 7,959
$ 67,889
$ 1,067
$ 1,124
$ 85,405
5,819
2,322
93,546
—
609
$ 94,155
$ 7,864
(481)
$ 7,383
$ 63,063
$ 878
$ 1,064
$ 172