United Healthcare 2011 Annual Report Download - page 70
Download and view the complete annual report
Please find page 70 of the 2011 United Healthcare annual report below. You can navigate through the pages in the report by either clicking on the pages listed below, or by using the keyword search tool below to find specific information within the annual report.-
 1
1 -
2
-
3
-
4
-
5
-
6
-
7
-
8
-
9
-
10
-
11
-
12
-
13
-
14
-
15
-
16
-
17
-
18
-
19
-
20
-
21
-
22
-
23
-
24
-
25
-
26
-
27
-
28
-
29
-
30
-
31
-
32
-
33
-
34
-
35
-
36
-
37
-
38
-
39
-
40
-
41
-
42
-
43
-
44
-
45
-
46
-
47
-
48
-
49
-
50
-
51
-
52
-
53
-
54
-
55
-
56
-
57
-
58
-
59
-
 60
60 -
 61
61 -
 62
62 -
 63
63 -
 64
64 -
 65
65 -
 66
66 -
 67
67 -
 68
68 -
 69
69 -
 70
70 -
 71
71 -
 72
72 -
 73
73 -
 74
74 -
 75
75 -
 76
76 -
 77
77 -
 78
78 -
 79
79 -
 80
80 -
81
-
82
-
83
-
84
-
85
-
86
-
87
-
88
-
89
-
90
-
91
-
92
-
93
-
94
-
95
-
96
-
97
-
98
-
99
-
100
-
101
-
102
-
103
-
104
 |
 |

68
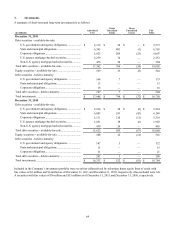
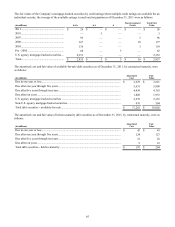
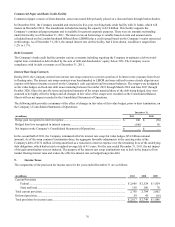
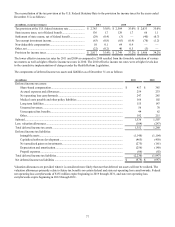
The following table presents a summary of fair value measurements by level for assets and liabilities measured at fair value on
a recurring basis, excluding AARP related assets and liabilities:
(in millions)
December 31, 2011
Cash and cash equivalents .................................................
Debt securities - available-for-sale:
U.S. government and agency obligations ...................
State and municipal obligations..................................
Corporate obligations..................................................
U.S. agency mortgage-backed securities....................
Non-U.S. agency mortgage-backed securities............
Total debt securities - available-for-sale............................
Equity securities - available-for-sale .................................
Total assets at fair value.....................................................
Percentage of total assets at fair value...............................
December 31, 2010
Cash and cash equivalents .................................................
Debt securities - available-for-sale:
U.S. government and agency obligations ...................
State and municipal obligations..................................
Corporate obligations..................................................
U.S. agency mortgage-backed securities....................
Non-U.S. agency mortgage-backed securities............
Total debt securities - available-for-sale............................
Equity securities - available-for-sale .................................
Total cash, cash equivalents and investments at fair value
Interest rate swap assets.....................................................
Total assets at fair value.....................................................
Percentage of total assets at fair value...............................
Interest rate swap liabilities ...............................................
Quoted Prices
in Active
Markets
(Level 1)
$ 8,569
1,551
—
16
—
—
1,567
333
$ 10,469
37%
$ 8,069
1,515
—
31
—
—
1,546
306
9,921
—
$ 9,921
39%
$ —
Other
Observable
Inputs
(Level 2)
$ 860
822
6,750
5,805
2,353
497
16,227
2
$ 17,089
61%
$ 1,054
719
6,148
5,146
1,903
457
14,373
2
15,429
46
$ 15,475
60%
$ 104
Unobservable
Inputs
(Level 3)
$ —
—
15
186
—
7
208
209
$ 417
2%
$ —
—
—
133
—
8
141
208
349
—
$ 349
1%
$ —
Total
Fair
Value
$ 9,429
2,373
6,765
6,007
2,353
504
18,002
544
$ 27,975
100%
$ 9,123
2,234
6,148
5,310
1,903
465
16,060
516
25,699
46
$ 25,745
100%
$ 104
There were no transfers between Levels 1 and 2 during the years ended December 31, 2011 and 2010.