United Healthcare 2011 Annual Report Download - page 72
Download and view the complete annual report
Please find page 72 of the 2011 United Healthcare annual report below. You can navigate through the pages in the report by either clicking on the pages listed below, or by using the keyword search tool below to find specific information within the annual report.-
 1
1 -
2
-
3
-
4
-
5
-
6
-
7
-
8
-
9
-
10
-
11
-
12
-
13
-
14
-
15
-
16
-
17
-
18
-
19
-
20
-
21
-
22
-
23
-
24
-
25
-
26
-
27
-
28
-
29
-
30
-
31
-
32
-
33
-
34
-
35
-
36
-
37
-
38
-
39
-
40
-
41
-
42
-
43
-
44
-
45
-
46
-
47
-
48
-
49
-
50
-
51
-
52
-
53
-
54
-
55
-
56
-
57
-
58
-
59
-
60
-
61
-
 62
62 -
 63
63 -
 64
64 -
 65
65 -
 66
66 -
 67
67 -
 68
68 -
 69
69 -
 70
70 -
 71
71 -
 72
72 -
 73
73 -
 74
74 -
 75
75 -
 76
76 -
 77
77 -
 78
78 -
 79
79 -
 80
80 -
 81
81 -
 82
82 -
83
-
84
-
85
-
86
-
87
-
88
-
89
-
90
-
91
-
92
-
93
-
94
-
95
-
96
-
97
-
98
-
99
-
100
-
101
-
102
-
103
-
104
 |
 |

70
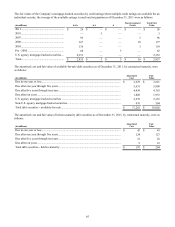
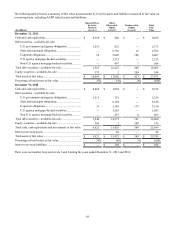
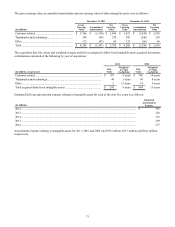
The table below includes fair values for certain financial instruments for which it is practicable to estimate fair value. The
carrying values and fair values of these financial instruments were as follows:
(in millions)
Assets
Debt securities - available-for-sale ....................................
Equity securities - available-for-sale .................................
Debt securities - held-to-maturity......................................
AARP Program-related investments..................................
Interest rate swap assets.....................................................
Liabilities
Senior unsecured notes ......................................................
Interest rate swap liabilities ...............................................
AARP Program-related other liabilities.............................
December 31, 2011
Carrying Value
$ 18,002
544
197
2,441
—
11,638
—
76
Fair Value
$ 18,002
544
204
2,441
—
13,149
—
76
December 31, 2010
Carrying Value
$ 16,060
516
203
2,435
46
10,212
104
59
Fair Value
$ 16,060
516
208
2,435
46
10,903
104
59
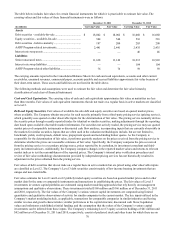
The carrying amounts reported in the Consolidated Balance Sheets for cash and cash equivalents, accounts and other current
receivables, unearned revenues, commercial paper, accounts payable and accrued liabilities approximate fair value because of
their short-term nature. These assets and liabilities are not listed in the table above.
The following methods and assumptions were used to estimate the fair value and determine the fair value hierarchy
classification of each class of financial instrument:
Cash and Cash Equivalents. The carrying value of cash and cash equivalents approximates fair value as maturities are less
than three months. Fair values of cash equivalent instruments that do not trade on a regular basis in active markets are classified
as Level 2.
Debt and Equity Securities. Fair values of available-for-sale debt and equity securities are based on quoted market prices,
where available. The Company obtains one price for each security primarily from a third-party pricing service (pricing service),
which generally uses quoted or other observable inputs for the determination of fair value. The pricing service normally derives
the security prices through recently reported trades for identical or similar securities, making adjustments through the reporting
date based upon available observable market information. For securities not actively traded, the pricing service may use quoted
market prices of comparable instruments or discounted cash flow analyses, incorporating inputs that are currently observable in
the markets for similar securities. Inputs that are often used in the valuation methodologies include, but are not limited to,
benchmark yields, credit spreads, default rates, prepayment speeds and non-binding broker quotes. As the Company is
responsible for the determination of fair value, it performs quarterly analyses on the prices received from the pricing service to
determine whether the prices are reasonable estimates of fair value. Specifically, the Company compares the prices received
from the pricing service to a secondary pricing source, prices reported by its custodian, its investment consultant and third-
party investment advisors. Additionally, the Company compares changes in the reported market values and returns to relevant
market indices to test the reasonableness of the reported prices. The Company’s internal price verification procedures and
review of fair value methodology documentation provided by independent pricing services has not historically resulted in
adjustment in the prices obtained from the pricing service.
Fair values of debt securities that do not trade on a regular basis in active markets but are priced using other observable inputs
are classified as Level 2. The Company’s Level 3 debt securities consist mainly of low income housing investments that are
unique and non-transferable.
Fair value estimates for Level 1 and Level 2 publicly traded equity securities are based on quoted market prices and/or other
market data for the same or comparable instruments and transactions in establishing the prices. The fair values of Level 3
investments in venture capital portfolios are estimated using market modeling approaches that rely heavily on management
assumptions and qualitative observations. These investments totaled $168 million and $166 million as of December 31, 2011
and 2010, respectively. The fair values of the Company’s various venture capital investments are computed using limited
quantitative and qualitative observations of activity for similar companies in the current market. The key inputs utilized in the
Company’s market modeling include, as applicable, transactions for comparable companies in similar industries and having
similar revenue and growth characteristics; similar preferences in the capital structure; discounted cash flows; liquidation
values and milestones established at initial funding; and the assumption that the values of the Company’s venture capital
investments can be inferred from these inputs. The Company’s remaining Level 3 equity securities holdings of $41 million and
$42 million as of December 31, 2011 and 2010, respectively, consist of preferred stock and other items for which there are no