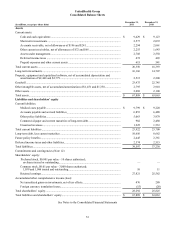
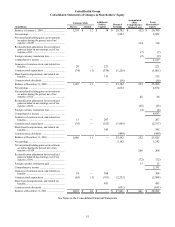
United Healthcare 2011 Annual Report Download - page 47
Download and view the complete annual report
Please find page 47 of the 2011 United Healthcare annual report below. You can navigate through the pages in the report by either clicking on the pages listed below, or by using the keyword search tool below to find specific information within the annual report.-
 1
1 -
2
-
3
-
4
-
5
-
6
-
7
-
8
-
9
-
10
-
11
-
12
-
13
-
14
-
15
-
16
-
17
-
18
-
19
-
20
-
21
-
22
-
23
-
24
-
25
-
26
-
27
-
28
-
29
-
30
-
31
-
32
-
33
-
34
-
35
-
36
-
 37
37 -
 38
38 -
 39
39 -
 40
40 -
 41
41 -
 42
42 -
 43
43 -
 44
44 -
 45
45 -
 46
46 -
 47
47 -
 48
48 -
 49
49 -
 50
50 -
 51
51 -
 52
52 -
 53
53 -
 54
54 -
 55
55 -
 56
56 -
 57
57 -
58
-
59
-
60
-
61
-
62
-
63
-
64
-
65
-
66
-
67
-
68
-
69
-
70
-
71
-
72
-
73
-
74
-
75
-
76
-
77
-
78
-
79
-
80
-
81
-
82
-
83
-
84
-
85
-
86
-
87
-
88
-
89
-
90
-
91
-
92
-
93
-
94
-
95
-
96
-
97
-
98
-
99
-
100
-
101
-
102
-
103
-
104
 |
 |

45
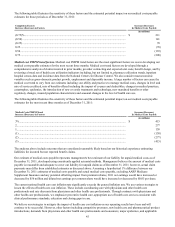
The following table illustrates the sensitivity of these factors and the estimated potential impact on our medical costs payable
estimates for those periods as of December 31, 2011:
Completion Factors
Increase (Decrease) in Factors
(0.75)%.............................................................................................................................................
(0.50) ................................................................................................................................................
(0.25) ................................................................................................................................................
0.25...................................................................................................................................................
0.50...................................................................................................................................................
0.75...................................................................................................................................................
Increase (Decrease)
In Medical Costs Payable
(in millions)
$ 211
141
70
(70)
(139)
(208)
Medical cost PMPM trend factors. Medical cost PMPM trend factors are the most significant factors we use in developing our
medical costs payable estimates for the most recent three months. Medical cost trend factors are developed through a
comprehensive analysis of claims incurred in prior months, provider contracting and expected unit costs, benefit design, and by
reviewing a broad set of health care utilization indicators including, but not limited to, pharmacy utilization trends, inpatient
hospital census data and incidence data from the National Centers for Disease Control. We also consider macroeconomic
variables such as gross-domestic product growth, employment and disposable income. A large number of factors can cause the
medical cost trend to vary from our estimates including: our ability and practices to manage medical costs, changes in level and
mix of services utilized, mix of benefits offered including the impact of co-pays and deductibles, changes in medical practices,
catastrophes, epidemics, the introduction of new or costly treatments and technology, new mandated benefits or other
regulatory changes, insured population characteristics and seasonal changes in the level of health care use.
The following table illustrates the sensitivity of these factors and the estimated potential impact on our medical costs payable
estimates for the most recent three months as of December 31, 2011:
Medical Costs PMPM Trend
Increase (Decrease) in Factors
3%.....................................................................................................................................................
2........................................................................................................................................................
1........................................................................................................................................................
(1) .....................................................................................................................................................
(2) .....................................................................................................................................................
(3) .....................................................................................................................................................
Increase (Decrease)
In Medical Costs Payable
(in millions)
$ 415
277
138
(138)
(277)
(415)
The analyses above include outcomes that are considered reasonably likely based on our historical experience estimating
liabilities for incurred but not reported benefit claims.
Our estimate of medical costs payable represents management's best estimate of our liability for unpaid medical costs as of
December 31, 2011, developed using consistently applied actuarial methods. Management believes the amount of medical costs
payable is reasonable and adequate to cover our liability for unpaid claims as of December 31, 2011; however, actual claim
payments may differ from established estimates as discussed above. Assuming a hypothetical 1% difference between our
December 31, 2011 estimates of medical costs payable and actual medical costs payable, excluding AARP Medicare
Supplement Insurance and any potential offsetting impact from premium rebates, 2011 net earnings would have increased or
decreased by $56 million and diluted net earnings per common share would have increased or decreased by $0.05 per share.
The current national health care cost inflation rate significantly exceeds the general inflation rate. We use various strategies to
lessen the effects of health care cost inflation. These include coordinating care with physicians and other health care
professionals and rate discounts from physicians and other health care professionals. Through contracts with physicians and
other health care professionals, we emphasize preventive health care, appropriate use of health care services consistent with
clinical performance standards, education and closing gaps in care.
We believe our strategies to mitigate the impact of health care cost inflation on our operating results have been and will
continue to be successful. However, other factors including competitive pressures, new health care and pharmaceutical product
introductions, demands from physicians and other health care professionals and consumers, major epidemics, and applicable