United Healthcare 2011 Annual Report Download - page 82
Download and view the complete annual report
Please find page 82 of the 2011 United Healthcare annual report below. You can navigate through the pages in the report by either clicking on the pages listed below, or by using the keyword search tool below to find specific information within the annual report.-
 1
1 -
2
-
3
-
4
-
5
-
6
-
7
-
8
-
9
-
10
-
11
-
12
-
13
-
14
-
15
-
16
-
17
-
18
-
19
-
20
-
21
-
22
-
23
-
24
-
25
-
26
-
27
-
28
-
29
-
30
-
31
-
32
-
33
-
34
-
35
-
36
-
37
-
38
-
39
-
40
-
41
-
42
-
43
-
44
-
45
-
46
-
47
-
48
-
49
-
50
-
51
-
52
-
53
-
54
-
55
-
56
-
57
-
58
-
59
-
60
-
61
-
62
-
63
-
64
-
65
-
66
-
67
-
68
-
69
-
70
-
71
-
 72
72 -
 73
73 -
 74
74 -
 75
75 -
 76
76 -
 77
77 -
 78
78 -
 79
79 -
 80
80 -
 81
81 -
 82
82 -
 83
83 -
 84
84 -
 85
85 -
 86
86 -
 87
87 -
 88
88 -
 89
89 -
 90
90 -
 91
91 -
 92
92 -
93
-
94
-
95
-
96
-
97
-
98
-
99
-
100
-
101
-
102
-
103
-
104
 |
 |

80
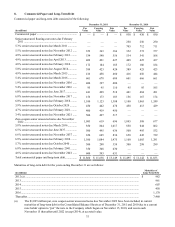
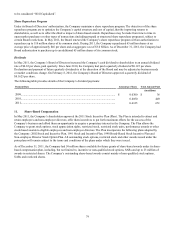
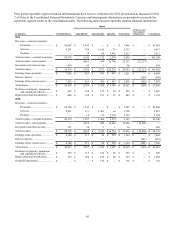
Stock Options and SARs
Stock options and SARs vest ratably over four to six years and may be exercised up to 10 years from the date of grant. Stock
option and SAR activity for the year ended December 31, 2011 is summarized in the table below:
Outstanding at beginning of period.....................................
Granted ................................................................................
Exercised .............................................................................
Forfeited ..............................................................................
Outstanding at end of period ...............................................
Exercisable at end of period ................................................
Vested and expected to vest end of period...........................
Shares
(in millions)
112
1
(18)
(4)
91
74
91
Weighted-
Average
Exercise
Price
$ 40
44
29
44
42
44
42
Weighted-
Average
Remaining
Contractual Life
(in years)
4.7
4.1
4.7
Aggregate
Intrinsic Value
(in millions)
$ 916
610
905
To determine compensation expense related to the Company’s stock options and SARs, the fair value of each award is
estimated on the date of grant using a binomial option-pricing model. The principal assumptions the Company used in applying
the option-pricing model were as follows:
Risk free interest rate..................................................................................
Expected volatility......................................................................................
Expected dividend yield.............................................................................
Forfeiture rate.............................................................................................
Expected life in years.................................................................................
2011
0.9% - 2.3%
44.3% - 45.1%
1.0% - 1.4%
5.0%
4.9 - 5.0
2010
1.0% - 2.1%
45.4% - 46.2%
0.1% - 1.7%
5.0%
4.6 - 5.1
2009
1.7%-2.4%
41.3% - 46.8%
0.1%
5.0%
4.4 - 5.1
Risk-free interest rates are based on U.S. Treasury yields in effect at the time of grant. Expected volatilities are based on the
historical volatility of the Company’s common stock and the implied volatility from exchange-traded options on the Company’s
common stock. Expected dividend yields are based on the per share dividend declared by the Company's Board of Directors.
The Company uses historical data to estimate option and SAR exercises and forfeitures within the valuation model. The
expected lives of options and SARs granted represents the period of time that the awards granted are expected to be outstanding
based on historical exercise patterns.
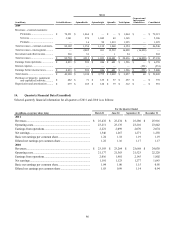
The weighted-average grant date fair value of stock options and SARs granted for 2011, 2010 and 2009 was approximately $15
per share, $13 per share and $10 per share, respectively. The total intrinsic value of stock options and SARs exercised during
2011, 2010 and 2009 was $327 million, $164 million and $282 million, respectively.
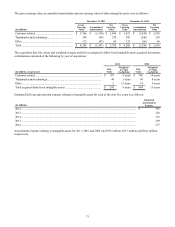
Restricted Shares
Restricted shares vest ratably over three to four years. Compensation expense related to restricted shares is based on the share
price on date of grant. Restricted share activity for the year ended December 31, 2011 is summarized in the table below:
(shares in millions)
Nonvested at beginning of period.............................................................................................
Granted......................................................................................................................................
Vested........................................................................................................................................
Forfeitures.................................................................................................................................
Nonvested at end of period .......................................................................................................
Shares
13
8
(3)
(1)
17
Weighted-
Average
Grant Date
Fair Value
per Share
$ 31
42
32
35
36
The weighted-average grant date fair value of restricted shares granted during 2011, 2010 and 2009 was approximately $42 per
share, $32 per share and $29 per share, respectively. The total fair value of restricted shares vested during 2011, 2010 and 2009
was $113 million, $99 million and $56 million, respectively.