Texas Instruments 2008 Annual Report Download - page 7
Download and view the complete annual report
Please find page 7 of the 2008 Texas Instruments annual report below. You can navigate through the pages in the report by either clicking on the pages listed below, or by using the keyword search tool below to find specific information within the annual report.-
 1
1 -
 2
2 -
 3
3 -
 4
4 -
 5
5 -
 6
6 -
 7
7 -
 8
8 -
 9
9 -
 10
10 -
 11
11 -
 12
12 -
 13
13 -
 14
14 -
 15
15 -
 16
16 -
 17
17 -
 18
18 -
19
-
20
-
21
-
22
-
23
-
24
-
25
-
26
-
27
-
28
-
29
-
30
-
31
-
32
-
33
-
34
-
35
-
36
-
37
-
38
-
39
-
40
-
41
-
42
-
43
-
44
-
45
-
46
-
47
-
48
-
49
-
50
-
51
-
52
-
53
-
54
 |
 |

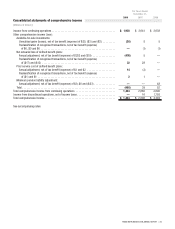
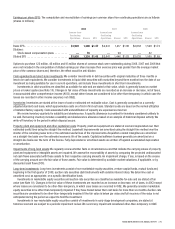
TEXAS INSTRUMENTS 2008 ANNUAL REPORT [ 5 ]
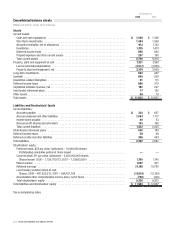
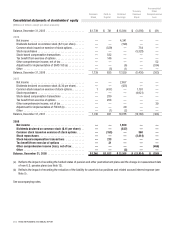
Consolidated statements of cash flows
[Millions of dollars]
For Years Ended
December 31,
2008 2007 2006
Cash flows from operating activities:
Net income ........................................................... $1,920 $2,657 $4,341
Adjustments to net income:
Income from discontinued operations ...................................... —(16) (1,703)
Depreciation ......................................................... 1,022 1,022 1,052
Stock-based compensation ............................................. 213 280 332
Amortization of acquisition-related intangibles ............................... 37 48 59
Losses (gains) on sales of assets ......................................... 6(39) —
Deferred income taxes ................................................. (182)34 (200)
Increase (decrease) from changes in:
Accounts receivable ................................................... 865 40 (116)
Inventories .......................................................... 43 11 (248)
Prepaid expenses and other current assets ................................. (125)13 (95)
Accounts payable and accrued expenses . . . . . . . . . . . . . . . . . . . . . . . . . . . . . . . . . . . (382)77 (104)
Income taxes payable .................................................. 38 304 (616)
Accrued profit sharing and retirement ..................................... (84)33 28
Other ................................................................ (41)(57)(274)
Net cash provided by operating activities of continuing operations .................... 3,330 4,407 2,456
Cash flows from investing activities:
Additions to property, plant and equipment ................................... (763)(686)(1,272)
Proceeds from sales of assets ............................................. —61 3,000
Purchases of short-term investments ........................................ (1,746)(5,035)(6,821)
Sales and maturities of short-term investments ................................ 1,300 5,981 8,418
Purchases of long-term investments ........................................ (9)(30)(40)
Sales of long-term investments ............................................ 55 11 11
Acquisitions, net of cash acquired .......................................... (19)(87)(205)
Net cash (used in) provided by investing activities of continuing operations ............. (1,182)215 3,091
Cash flows from financing activities:
Payments on long-term debt .............................................. —(43)(586)
Dividends paid ......................................................... (537)(425)(199)
Sales and other common stock transactions .................................. 210 761 418
Excess tax benefit from stock option exercises ................................ 19 116 100
Stock repurchases ...................................................... (2,122)(4,886) (5,302)
Net cash used in financing activities of continuing operations ........................ (2,430)(4,477) (5,569)
Cash flows from discontinued operations:
Operating activities ...................................................... —— 7
Investing activities ...................................................... ——(16)
Net cash used in discontinued operations ....................................... ——(9)
Net (decrease) increase in cash and cash equivalents ............................. (282)145 (31)
Cash and cash equivalents at beginning of year .................................. 1,328 1,183 1,214
Cash and cash equivalents at end of year ....................................... $1,046 $1,328 $1,183
See accompanying notes.