Texas Instruments 2008 Annual Report Download - page 14
Download and view the complete annual report
Please find page 14 of the 2008 Texas Instruments annual report below. You can navigate through the pages in the report by either clicking on the pages listed below, or by using the keyword search tool below to find specific information within the annual report.-
 1
1 -
2
-
3
-
 4
4 -
 5
5 -
 6
6 -
 7
7 -
 8
8 -
 9
9 -
 10
10 -
 11
11 -
 12
12 -
 13
13 -
 14
14 -
 15
15 -
 16
16 -
 17
17 -
 18
18 -
 19
19 -
 20
20 -
 21
21 -
 22
22 -
 23
23 -
 24
24 -
25
-
26
-
27
-
28
-
29
-
30
-
31
-
32
-
33
-
34
-
35
-
36
-
37
-
38
-
39
-
40
-
41
-
42
-
43
-
44
-
45
-
46
-
47
-
48
-
49
-
50
-
51
-
52
-
53
-
54
 |
 |

[ 12 ] TEXAS INSTRUMENTS 2008 ANNUAL REPORT
In the fourth quarter of 2008, we recognized $230 million in restructuring charges related to these actions, which included
$121 million for a portion of the actions announced in January 2009 and $109 million for the Wireless actions announced in October
2008. The restructuring costs consisted of $218 million for severance and benefits costs and $12 million related to impairments of
long-lived assets. We also fully impaired $24 million of assets that were held for sale related to a 2007 action discussed below.
As of December 31, 2008, $2 million has been paid for these actions to terminated employees for severance and benefits.
2007 actions
In January 2007, we announced plans to change how we develop advanced digital manufacturing process technology. Instead of
separately creating our own core process technology, we work collaboratively with our foundry partners to specify and drive the next
generations of digital process technology. Additionally, we stopped production at an older digital factory. These actions are complete and
as a result, about 300 jobs were eliminated by year-end 2007.
Operating profit for 2007 included a charge of $52 million related to these actions, which consisted of severance and benefits costs
of $31 million and acceleration of depreciation on the impacted facilities’ assets of $21 million. These amounts have been reclassified
from cost of revenue ($37 million), R&D ($14 million) and SG&A ($1 million) to the restructuring expense line on the income statement to
conform to the 2008 presentation.
As of December 31, 2008, $19 million has been paid for these actions to terminated employees for severance and benefits.
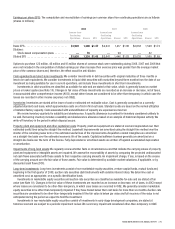
3. Stock-based compensation
2008 2007 2006
Stock-based compensation expense recognized:
Cost of revenue . . . . . . . . . . . . . . . . . . . . . . . . . . . . . . . . . . . . . . . . . . . . . . . . . . . . . . . . . . . . . . . . . . $41 $53 $64
Research and development ......................................................... 62 83 101
Selling, general and administrative ................................................... 110 144 167
Total .......................................................................... $213 $280 $332
These amounts include expense related to non-qualified stock options, RSUs and to stock options offered under our employee stock
purchase plan.
We issue awards of non-qualified stock options generally with graded vesting provisions (e.g., 25 percent per year for four years). In
such cases, we recognize the related compensation cost on a straight-line basis over the minimum service period required for vesting
of the award. For awards to employees who are retirement eligible or nearing retirement eligibility, we recognize compensation cost
on a straight-line basis over the longer of the service period required to be performed by the employee in order to earn the award, or a
six-month period.
We also issue RSUs, which generally vest four years after the date of grant. In such cases, we recognize the related compensation
costs on a straight-line basis over the vesting period.
Fair value assumptions:
We estimated the fair values for non-qualified stock options using the Black-Scholes option-pricing model with the following weighted-
average assumptions:
Long-term plans (a) 2008 2007 2006
Weighted average grant date fair value, per share ................................. $ 8.86$ 9.72 $ 11.82
Weighted average assumptions used:
Expected volatility ...................................................... 31%28%34%
Expected lives . . . . . . . . . . . . . . . . . . . . . . . . . . . . . . . . . . . . . . . . . . . . . . . . . . . . . . . . . 5.7 yrs 5.6 yrs 5.0 yrs
Risk-free interest rates .................................................. 3.01%4.73%4.50%
Expected dividend yields ................................................. 1.34%0.57%0.37%
(a) Includes stock options under the long-term incentive plans and the director plans.