Texas Instruments 2008 Annual Report Download - page 4
Download and view the complete annual report
Please find page 4 of the 2008 Texas Instruments annual report below. You can navigate through the pages in the report by either clicking on the pages listed below, or by using the keyword search tool below to find specific information within the annual report.-
 1
1 -
 2
2 -
 3
3 -
 4
4 -
 5
5 -
 6
6 -
 7
7 -
 8
8 -
 9
9 -
 10
10 -
 11
11 -
 12
12 -
 13
13 -
 14
14 -
 15
15 -
16
-
17
-
18
-
19
-
20
-
21
-
22
-
23
-
24
-
25
-
26
-
27
-
28
-
29
-
30
-
31
-
32
-
33
-
34
-
35
-
36
-
37
-
38
-
39
-
40
-
41
-
42
-
43
-
44
-
45
-
46
-
47
-
48
-
49
-
50
-
51
-
52
-
53
-
54
 |
 |

[ 2 ] TEXAS INSTRUMENTS 2008 ANNUAL REPORT
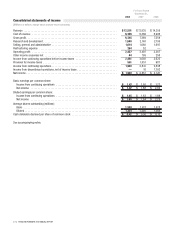
Consolidated statements of income
[Millions of dollars, except share and per-share amounts]
For Years Ended
December 31,
2008 2007 2006
Revenue .................................................................. $12,501 $13,835 $14,255
Cost of revenue ............................................................ 6,256 6,466 6,996
Gross profit ................................................................ 6,245 7,369 7,259
Research and development .................................................... 1,940 2,140 2,195
Selling, general and administrative .............................................. 1,614 1,680 1,697
Restructuring expense ....................................................... 254 52 —
Operating profit ............................................................ 2,437 3,497 3,367
Other income (expense) net ................................................... 44 195 258
Income from continuing operations before income taxes ............................. 2,481 3,692 3,625
Provision for income taxes .................................................... 561 1,051 987
Income from continuing operations .............................................. 1,920 2,641 2,638
Income from discontinued operations, net of income taxes ............................ —16 1,703
Net income ................................................................ $1,920 $2,657 $4,341
Basic earnings per common share:
Income from continuing operations ........................................... $1.47 $1.86 $1.73
Net income ............................................................. $1.47 $1.88 $2.84
Diluted earnings per common share:
Income from continuing operations ........................................... $1.45 $1.83 $1.69
Net income ............................................................. $1.45 $1.84 $2.78
Average shares outstanding (millions):
Basic .................................................................. 1,308 1,417 1,528
Diluted ................................................................. 1,324 1,446 1,560
Cash dividends declared per share of common stock ................................ $0.41 $0.30 $0.13
See accompanying notes.