Texas Instruments 2008 Annual Report Download - page 17
Download and view the complete annual report
Please find page 17 of the 2008 Texas Instruments annual report below. You can navigate through the pages in the report by either clicking on the pages listed below, or by using the keyword search tool below to find specific information within the annual report.-
 1
1 -
2
-
3
-
4
-
5
-
6
-
 7
7 -
 8
8 -
 9
9 -
 10
10 -
 11
11 -
 12
12 -
 13
13 -
 14
14 -
 15
15 -
 16
16 -
 17
17 -
 18
18 -
 19
19 -
 20
20 -
 21
21 -
 22
22 -
 23
23 -
 24
24 -
 25
25 -
 26
26 -
 27
27 -
28
-
29
-
30
-
31
-
32
-
33
-
34
-
35
-
36
-
37
-
38
-
39
-
40
-
41
-
42
-
43
-
44
-
45
-
46
-
47
-
48
-
49
-
50
-
51
-
52
-
53
-
54
 |
 |

TEXAS INSTRUMENTS 2008 ANNUAL REPORT [ 15 ]
The weighted average grant-date fair value of options granted under the employee stock purchase plans during the years 2008, 2007
and 2006 was $3.37, $5.10 and $4.68 per share. During the years ended December 31, 2008, 2007 and 2006, the total intrinsic value
of options exercised under the employee stock plans was $11 million, $11 million and $10 million.
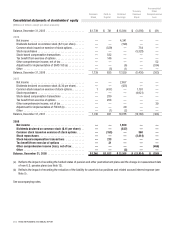
Effect on shares outstanding and treasury shares
Our practice is to issue shares of common stock upon exercise of stock options generally from treasury shares and, on a limited basis,
from previously unissued shares. We settled stock option plan exercises using treasury shares of 11,217,809 in 2008; 39,791,295 in
2007 and 26,602,306 in 2006; and previously unissued common shares of 85,472 in 2008; 511,907 in 2007 and 49,100 in 2006.
Upon vesting of RSUs, we issued treasury shares of 544,404 in 2008; 515,209 in 2007 and 128,578 in 2006; and previously
unissued common shares of zero in 2008; 12,000 in 2007 and 279,082 in 2006.
Shares available for future grant and reserved for issuance are summarized below:
As of December 31, 2008
Shares
Long-term Incentive
and Director
Compensation Plans
TI Employees 2005
Stock Purchase Plan
Available for future grant ................................................ 207,593,706 34,945,485
Reserved for issuance .................................................. 400,526,959 35,985,028
Effect on cash flows
Cash received from the exercise of options was $210 million in 2008, $761 million in 2007 and $418 million in 2006. The related
net tax benefit realized was $31 million, $204 million and $146 million (which includes excess tax benefits realized of $19 million,
$116 million and $100 million) in 2008, 2007 and 2006.
4. Profit sharing plans
Profit sharing benefits are generally formulaic and determined by one or more subsidiary or company-wide financial metrics. We pay
profit sharing benefits primarily under the company-wide TI Employee Profit Sharing Plan. This plan provides for profit sharing to be paid
based solely on TI’s operating margin for the full calendar year. Under this plan, TI must achieve a minimum threshold of 10 percent
operating margin before any profit sharing is paid. At 10 percent operating margin, profit sharing will be 2 percent of eligible payroll. The
maximum amount of profit sharing available under the plan is 20 percent of eligible payroll, which is paid only if TI’s operating margin is
at or above 35 percent for a full calendar year.
We recognized $121 million, $180 million and $149 million of profit sharing expense under the TI Employee Profit Sharing Plan in
2008, 2007 and 2006.
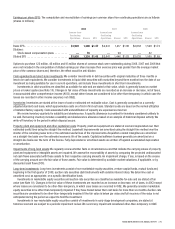
5. Income taxes
Income from continuing operations before income taxes
U.S. Non-U.S. Total
2008 ...................................................................... $ 1,749 $ 732 $ 2,481
2007 ...................................................................... 2,738 954 3,692
2006 ...................................................................... 2,582 1,043 3,625