Texas Instruments 2008 Annual Report Download - page 20
Download and view the complete annual report
Please find page 20 of the 2008 Texas Instruments annual report below. You can navigate through the pages in the report by either clicking on the pages listed below, or by using the keyword search tool below to find specific information within the annual report.-
 1
1 -
2
-
3
-
4
-
5
-
6
-
7
-
8
-
9
-
 10
10 -
 11
11 -
 12
12 -
 13
13 -
 14
14 -
 15
15 -
 16
16 -
 17
17 -
 18
18 -
 19
19 -
 20
20 -
 21
21 -
 22
22 -
 23
23 -
 24
24 -
 25
25 -
 26
26 -
 27
27 -
 28
28 -
 29
29 -
 30
30 -
31
-
32
-
33
-
34
-
35
-
36
-
37
-
38
-
39
-
40
-
41
-
42
-
43
-
44
-
45
-
46
-
47
-
48
-
49
-
50
-
51
-
52
-
53
-
54
 |
 |

[ 18 ] TEXAS INSTRUMENTS 2008 ANNUAL REPORT
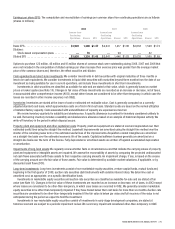
6. Discontinued operations
As discussed in Note 1, in 2006 we sold substantially all of our former Sensors & Controls segment.
The results of operations of our former Sensors & Controls business, which was renamed Sensata Technologies (Sensata), are presented
as discontinued operations. The following summarizes results of the discontinued operations for the years ended December 31, 2007
and 2006, included in the consolidated statements of income:
2007 2006
Revenue ............................................................................ $ — $ 375
Operating costs and expenses............................................................ 4327
Income (loss) from discontinued operations before income taxes ................................. (4)48
Provision (benefit) for income taxes........................................................ (3)19
Income (loss) from discontinued operations, net of income taxes ................................. (1) 29
Gain on sale of discontinued operations..................................................... —2,554
Provision (benefit) for income taxes........................................................ (17)880
Gain on sale of discontinued operations, net of income taxes .................................... 17 1,674
Total income from discontinued operations .................................................. $16 $1,703
Income from discontinued operations per common share: (a)
Basic ............................................................................ $0.01 $1.11
Diluted........................................................................... $0.01 $1.09
(a) EPS amounts from continuing and discontinued operations may not add to net income per share due to rounding.
Total income from discontinued operations in 2007 includes an income tax benefit related to a reduction of a state tax liability
associated with the sale.
7. Financial instruments and risk concentration
Financial instruments: We have derivative financial instruments of insignificant fair value as of December 31, 2008, such as forward
foreign currency exchange contracts, forward purchase contracts and investment warrants. Our forward foreign currency exchange
contracts outstanding at December 31, 2008, had a notional value of $600 million to hedge our non-U.S. dollar net balance sheet
exposures (including $187 million to sell euros, $34 million to sell British pounds and $263 million to sell Japanese yen).
Cash equivalents, short-term investments, certain long-term investments and deferred compensation liabilities are carried at
fair value. The carrying values for other current financial assets and liabilities, such as accounts receivable and accounts payable,
approximate fair value due to their short maturity.
Risk concentration: Financial instruments that could subject us to concentrations of credit risk are primarily cash and short-term
investments and accounts receivable. In order to manage our credit risk exposure, we place cash investments in investment-grade debt
securities and limit the amount of credit exposure to any one issuer. We also limit counterparties on forward foreign currency exchange
contracts to investment-grade-rated financial institutions.
Concentrations of credit risk with respect to accounts receivable are limited due to the large number of customers in our customer
base and their dispersion across different industries and geographic areas. We maintain an allowance for losses based on the expected
collectibility of accounts receivable. These allowances are deducted from accounts receivable on our balance sheets. Details of these
allowances are as follows:
Accounts Receivable Allowances
Balance at
Beginning of Year
Additions Charged
to Operating
Results
Recoveries and
Write-offs, Net
Balance at
End of Year
2008 ............................................... $ 26 $ 7 $ (3) $ 30
2007 ............................................... $ 26 $ — $ — $ 26
2006 ............................................... $ 34 $ 2 $ (10) $ 26