Shutterfly 2007 Annual Report Download - page 47
Download and view the complete annual report
Please find page 47 of the 2007 Shutterfly annual report below. You can navigate through the pages in the report by either clicking on the pages listed below, or by using the keyword search tool below to find specific information within the annual report.-
 1
1 -
2
-
3
-
4
-
5
-
6
-
7
-
8
-
9
-
10
-
11
-
12
-
13
-
14
-
15
-
16
-
17
-
18
-
19
-
20
-
21
-
22
-
23
-
24
-
25
-
26
-
27
-
28
-
29
-
30
-
31
-
32
-
33
-
34
-
35
-
36
-
 37
37 -
 38
38 -
 39
39 -
 40
40 -
 41
41 -
 42
42 -
 43
43 -
 44
44 -
 45
45 -
 46
46 -
 47
47 -
 48
48 -
 49
49 -
 50
50 -
 51
51 -
 52
52 -
 53
53 -
 54
54 -
 55
55 -
 56
56 -
 57
57 -
58
-
59
-
60
-
61
-
62
-
63
-
64
-
65
-
66
-
67
-
68
-
69
-
70
-
71
-
72
-
73
-
74
-
75
-
76
-
77
-
78
-
79
-
80
-
81
-
82
-
83
-
84
-
85
-
86
-
87
-
88
-
89
-
90
-
91
-
92
-
93
-
94
-
95
-
96
-
97
-
98
-
99
-
100
-
101
-
102
-
103
-
104
-
105
-
106
-
107
-
108
-
109
-
110
-
111
-
112
-
113
-
114
-
115
-
116
-
117
-
118
-
119
-
120
-
121
-
122
-
123
-
124
-
125
 |
 |

Table of Contents
Liquidity and Capital Resources
We anticipate that our current cash and cash equivalents balances and cash generated from operations will be
sufficient to meet our working capital requirements, capital lease obligations, expansion plans and technology
development projects for at least the next 12 months. The adequacy of these resources to meeting our liquidity needs
beyond that period will depend on our growth, operating results and the capital expenditures required to meet
possible increased demand for our products. If we require additional capital resources to grow our business internally
or to acquire complementary technologies and businesses at any time in the future, we may seek to sell additional
equity. The sale of additional equity could result in additional dilution to our stockholders. Financing arrangements
may not be available to us, or may not be in amounts or on terms acceptable to us.
Historically we have financed our operations and capital expenditures through operations, private sales of
preferred stock, our initial public offering, lease financing and the use of bank and related-party loans. As a result of
our initial public offering in September 2006, we raised approximately $80.9 million of proceeds, net of
underwriters’
discount, which we received on October 4, 2006. At December 31, 2006 we had $119.1 million of cash
and cash equivalents. Cash equivalents are compromised of money market funds and investment-grade corporate
bonds.
Our industry is competitive and has endured periods of intense price competition. Because we plan to finance
our operations and capital expenses largely through our operations, and because our results of operations are
sensitive to the level of competition we face, increased competition could adversely affect our liquidity and capital
resources. Increased competition could do so both by reducing our revenues and net income, as a result of reduced
sales, reduced prices and increased promotional activities, among other factors, as well as by requiring us to spend
cash on advertising and marketing in an effort to maintain or increase market share in the face of such competition.
In addition, we intend to increase many of our expenses, including some capital expenses and some sales and
marketing expense, in advance of anticipated higher future revenues. However, such increased expenses, while
intended to support anticipated increases in future revenues, must be funded from current capital resources or from
borrowings or equity financings. As a result, our ability to grow our business relying largely on funds from our
operations is sensitive to competitive pressures and other risks relating to our liquidity or capital resources.
We anticipate capital expenditures of $25 million to $29 million for 2007, approximately 40% to 50% of which
we expect will be used to add manufacturing capacity. These expansion plans, while significant, are not outside the
ordinary course of our business or materially different from how we have expanded our business in the past. We
expect that such capital expenditures will increase our production capacity and help enable us to respond more
quickly and efficiently to customer demand. We believe that such capital expenditures will have a positive effect on
our results of operations if demand increases in line with increases in our production capacity. However, these capital
expenditures will have a negative effect on our results of operations if demand does not increase as we expect, and
will have a negative effect on our results of operations in the short term if demand does not increase simultaneously,
as we expect, with the capital expenditures spent to support increased demand.
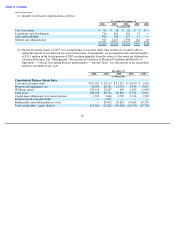
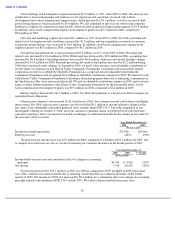
Operating Activities. For 2006, net cash provided by operating activities was $23.5 million, primarily due to
our net income of $5.8 million and the net change in operating assets and liabilities of $0.7 million, adjusted for non-
cash items including $10.5 million of depreciation and amortization expense, $3.2 million of provision for income
taxes, $2.3 million of stock-based compensation and $0.9 million for charitable contribution expense related to our
42
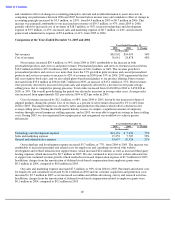
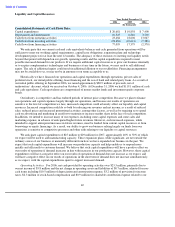
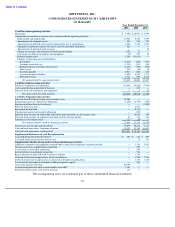
Year Ended December 31,
2006
2005
2004
(In thousands)
Consolidated Statements of Cash Flows Data:
Capital expenditures
$
20,681
$
10,858
$
7,400
Depreciation and amortization
10,525
6,246
3,769
Cash flows from operating activities
23,484
18,606
13,067
Cash flows from investing activities
(20,681
)
(10,613
)
(7,386
)
Cash flows from financing activities
77,095
17,379
(2,570
)