Rite Aid 2014 Annual Report Download - page 45
Download and view the complete annual report
Please find page 45 of the 2014 Rite Aid annual report below. You can navigate through the pages in the report by either clicking on the pages listed below, or by using the keyword search tool below to find specific information within the annual report.-
 1
1 -
2
-
3
-
4
-
5
-
6
-
7
-
8
-
9
-
10
-
11
-
12
-
13
-
14
-
15
-
16
-
17
-
18
-
19
-
20
-
21
-
22
-
23
-
24
-
25
-
26
-
27
-
28
-
29
-
30
-
31
-
32
-
33
-
34
-
 35
35 -
 36
36 -
 37
37 -
 38
38 -
 39
39 -
 40
40 -
 41
41 -
 42
42 -
 43
43 -
 44
44 -
 45
45 -
 46
46 -
 47
47 -
 48
48 -
 49
49 -
 50
50 -
 51
51 -
 52
52 -
 53
53 -
 54
54 -
 55
55 -
56
-
57
-
58
-
59
-
60
-
61
-
62
-
63
-
64
-
65
-
66
-
67
-
68
-
69
-
70
-
71
-
72
-
73
-
74
-
75
-
76
-
77
-
78
-
79
-
80
-
81
-
82
-
83
-
84
-
85
-
86
-
87
-
88
-
89
-
90
-
91
-
92
-
93
-
94
-
95
-
96
-
97
-
98
-
99
-
100
-
101
-
102
-
103
-
104
-
105
-
106
-
107
-
108
-
109
-
110
-
111
-
112
-
113
-
114
-
115
-
116
-
117
-
118
-
119
-
120
-
121
-
122
 |
 |

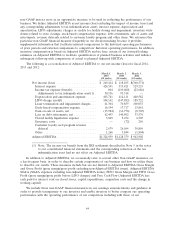
non-GAAP metrics serve as an appropriate measure to be used in evaluating the performance of our
business. We define Adjusted EBITDA as net income (loss) excluding the impact of income taxes (and
any corresponding adjustments to tax indemnification asset), interest expense, depreciation and
amortization, LIFO adjustments, charges or credits for facility closing and impairment, inventory write-
downs related to store closings, stock-based compensation expense, debt retirements, sale of assets and
investments, revenue deferrals related to customer loyalty program and other items. We reference this
particular non-GAAP financial measure frequently in our decision-making because it provides
supplemental information that facilitates internal comparisons to the historical operating performance
of prior periods and external comparisons to competitors’ historical operating performance. In addition,
incentive compensation is based on Adjusted EBITDA and we base certain of our forward-looking
estimates on Adjusted EBITDA to facilitate quantification of planned business activities and enhance
subsequent follow-up with comparisons of actual to planned Adjusted EBITDA.
The following is a reconciliation of Adjusted EBITDA to our net income (loss) for fiscal 2014,
2013 and 2012:
March 1, March 2, March 3,
2014 2013 2012
(52 weeks) (52 weeks) (53 weeks)
Net income (loss) ....................... $ 249,414 $ 118,105 $(368,571)
Interest expense ...................... 424,591 515,421 529,255
Income tax expense (benefit) ............. 804 (110,600) (23,686)
Adjustments to tax indemnification asset(1) . 30,516 91,314 —
Depreciation and amortization expense ...... 403,741 414,111 440,582
LIFO charge (credit) ................... 104,142 (147,882) 188,722
Lease termination and impairment charges . . . 41,304 70,859 100,053
Stock-based compensation expense ......... 16,194 17,717 15,861
Gain on sale of assets, net ............... (15,984) (16,776) (8,703)
Loss on debt retirements, net ............. 62,443 140,502 33,576
Closed facility liquidation expense ......... 3,849 5,272 6,505
Severance costs ....................... — (72) 256
Customer loyalty card program revenue
deferral ........................... 2,679 26,564 30,856
Other .............................. 1,266 3,844 (1,804)
Adjusted EBITDA ...................... $1,324,959 $1,128,379 $ 942,902
(1) Note: The income tax benefit from the IRS settlement described in Note 5 in the notes
to our consolidated financial statements and the corresponding reduction of the tax
indemnification asset had no net effect on Adjusted EBITDA.
In addition to Adjusted EBITDA, we occasionally refer to several other Non-GAAP measures, on
a less frequent basis, in order to describe certain components of our business and how we utilize them
to describe our results. These measures include but are not limited to Adjusted EBITDA Gross Margin
and Gross Profit (gross margin/gross profit excluding non-Adjusted EBITDA items), Adjusted EBITDA
SG&A (SG&A expenses excluding non-Adjusted EBITDA items), FIFO Gross Margin and FIFO Gross
Profit (gross margin/gross profit before LIFO charges) and Free Cash Flow (Adjusted EBITDA less
cash paid for interest, rent on closed stores, capital expenditures, acquisition costs and the change in
working capital).
We include these non-GAAP financial measures in our earnings announcements and guidance in
order to provide transparency to our investors and enable investors to better compare our operating
performance with the operating performance of our competitors including with those of our
44