Rite Aid 2014 Annual Report Download - page 29
Download and view the complete annual report
Please find page 29 of the 2014 Rite Aid annual report below. You can navigate through the pages in the report by either clicking on the pages listed below, or by using the keyword search tool below to find specific information within the annual report.-
 1
1 -
2
-
3
-
4
-
5
-
6
-
7
-
8
-
9
-
10
-
11
-
12
-
13
-
14
-
15
-
16
-
17
-
18
-
 19
19 -
 20
20 -
 21
21 -
 22
22 -
 23
23 -
 24
24 -
 25
25 -
 26
26 -
 27
27 -
 28
28 -
 29
29 -
 30
30 -
 31
31 -
 32
32 -
 33
33 -
 34
34 -
 35
35 -
 36
36 -
 37
37 -
 38
38 -
 39
39 -
40
-
41
-
42
-
43
-
44
-
45
-
46
-
47
-
48
-
49
-
50
-
51
-
52
-
53
-
54
-
55
-
56
-
57
-
58
-
59
-
60
-
61
-
62
-
63
-
64
-
65
-
66
-
67
-
68
-
69
-
70
-
71
-
72
-
73
-
74
-
75
-
76
-
77
-
78
-
79
-
80
-
81
-
82
-
83
-
84
-
85
-
86
-
87
-
88
-
89
-
90
-
91
-
92
-
93
-
94
-
95
-
96
-
97
-
98
-
99
-
100
-
101
-
102
-
103
-
104
-
105
-
106
-
107
-
108
-
109
-
110
-
111
-
112
-
113
-
114
-
115
-
116
-
117
-
118
-
119
-
120
-
121
-
122
 |
 |

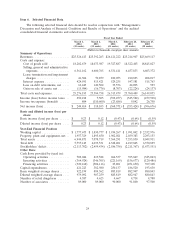
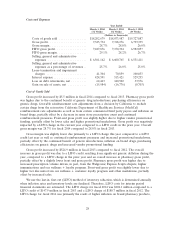
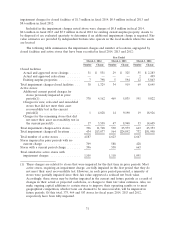
Costs and Expenses
Year Ended
March 1, 2014 March 2, 2013 March 3, 2012
(52 Weeks) (52 Weeks) (53 Weeks)
(Dollars in thousands)
Costs of goods sold ................ $18,202,679 $18,073,987 $19,327,887
Gross profit ...................... 7,323,734 7,318,276 6,793,335
Gross margin ..................... 28.7% 28.8% 26.0%
FIFO gross profit .................. 7,427,876 7,170,394 6,982,057
FIFO gross margin ................. 29.1% 28.2% 26.7%
Selling, general and administrative
expenses ...................... $ 6,561,162 $ 6,600,765 $ 6,531,411
Selling, general and administrative
expenses as a percentage of revenues . . 25.7% 26.0% 25.0%
Lease termination and impairment
charges ....................... 41,304 70,859 100,053
Interest expense ................... 424,591 515,421 529,255
Loss on debt retirements, net ......... 62,443 140,502 33,576
Gain on sale of assets, net ........... (15,984) (16,776) (8,703)
Cost of Goods Sold
Gross profit increased by $5.5 million in fiscal 2014 compared to fiscal 2013. Pharmacy gross profit
was higher due to the continued benefit of generic drug introductions, purchasing efficiencies on
generic drugs, favorable reimbursement rate adjustments from a decision by California to exclude
certain drugs from the retroactive California Department of Healthcare Services (MediCal)
reimbursement rate adjustments as well as from certain commercial third party payors and inflation on
brand drugs, partially offset by a decrease in same store prescription count and continued
reimbursement pressures. Front-end gross profit was slightly higher due to higher vendor promotional
funding, partially offset by lower sales and higher promotional markdowns. Gross profit was negatively
impacted by a LIFO charge in the current year compared to a LIFO credit in the prior year. Overall
gross margin was 28.7% for fiscal 2014 compared to 28.8% in fiscal 2013.
Gross margin was slightly lower due primarily to a LIFO charge this year compared to a LIFO
credit last year as well as continued reimbursement pressures and increased promotional markdowns,
partially offset by the continued benefit of generic introductions, inflation on brand drugs, purchasing
efficiencies on generic drugs and increased vendor promotional funding.
Gross profit increased by $524.9 million in fiscal 2013 compared to fiscal 2012. The overall
increase in gross profit was due to a LIFO credit resulting from significant generic deflation during the
year, compared to a LIFO charge in the prior year and an overall increase in pharmacy gross profit,
partially offset by a slightly lower front end gross profit. Pharmacy gross profit was higher due to
increased prescription volume driven, in part, from the Walgreens/ Express Scripts dispute, higher
immunizations and our wellness + loyalty program. Front-end gross profit was slightly lower due to
higher tier discounts from our wellness + customer loyalty program and other markdowns, partially
offset by increased sales.
We use the last-in, first-out (LIFO) method of inventory valuation, which is determined annually
when inflation rates and inventory levels are finalized. Therefore, LIFO costs for interim period
financial statements are estimated. The LIFO charge for fiscal 2014 was $104.1 million compared to a
LIFO credit of $147.9 million in fiscal 2013 and a LIFO charge of $188.7 million in fiscal 2012. The
LIFO charge for fiscal 2014 was primarily the result of higher inflation on brand pharmacy products,
28