Rite Aid 2013 Annual Report Download - page 76
Download and view the complete annual report
Please find page 76 of the 2013 Rite Aid annual report below. You can navigate through the pages in the report by either clicking on the pages listed below, or by using the keyword search tool below to find specific information within the annual report.-
 1
1 -
2
-
3
-
4
-
5
-
6
-
7
-
8
-
9
-
10
-
11
-
12
-
13
-
14
-
15
-
16
-
17
-
18
-
19
-
20
-
21
-
22
-
23
-
24
-
25
-
26
-
27
-
28
-
29
-
30
-
31
-
32
-
33
-
34
-
35
-
36
-
37
-
38
-
39
-
40
-
41
-
42
-
43
-
44
-
45
-
46
-
47
-
48
-
49
-
50
-
51
-
52
-
53
-
54
-
55
-
56
-
57
-
58
-
59
-
60
-
61
-
62
-
63
-
64
-
65
-
 66
66 -
 67
67 -
 68
68 -
 69
69 -
 70
70 -
 71
71 -
 72
72 -
 73
73 -
 74
74 -
 75
75 -
 76
76 -
 77
77 -
 78
78 -
 79
79 -
 80
80 -
 81
81 -
 82
82 -
 83
83 -
 84
84 -
 85
85 -
 86
86 -
87
-
88
-
89
-
90
-
91
-
92
-
93
-
94
-
95
-
96
-
97
-
98
-
99
-
100
-
101
-
102
-
103
-
104
-
105
-
106
-
107
-
108
-
109
-
110
-
111
-
112
-
113
-
114
-
115
-
116
-
117
-
118
-
119
-
120
-
121
-
122
-
123
-
124
-
125
 |
 |

RITE AID CORPORATION AND SUBSIDIARIES
NOTES TO CONSOLIDATED FINANCIAL STATEMENTS (Continued)
For the Years Ended March 2, 2013, March 3, 2012 and February 26, 2011
(In thousands, except per share amounts)
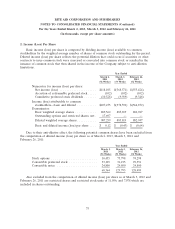
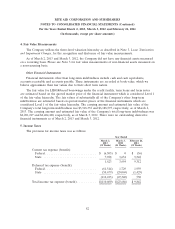
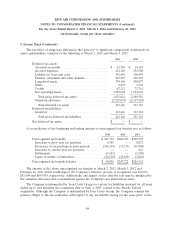
2. Income (Loss) Per Share
Basic income (loss) per share is computed by dividing income (loss) available to common
stockholders by the weighted average number of shares of common stock outstanding for the period.
Diluted income (loss) per share reflects the potential dilution that could occur if securities or other
contracts to issue common stock were exercised or converted into common stock or resulted in the
issuance of common stock that then shared in the income of the Company subject to anti-dilution
limitations.
Year Ended
March 2, March 3, February 26,
2013 2012 2011
(52 Weeks) (53 Weeks) (52 Weeks)
Numerator for income (loss) per share:
Net income (loss) ..................... $118,105 $(368,571) $(555,424)
Accretion of redeemable preferred stock ..... (102) (102) (102)
Cumulative preferred stock dividends ....... (10,528) (9,919) (9,346)
Income (loss) attributable to common
stockholders—basic and diluted ........... $107,475 $(378,592) $(564,872)
Denominator:
Basic weighted average shares ............ 889,562 885,819 882,947
Outstanding options and restricted shares, net . 17,697 — —
Diluted weighted average shares ........... 907,259 885,819 882,947
Basic and diluted income (loss) per share .... $ 0.12 $ (0.43) $ (0.64)
Due to their anti-dilutive effect, the following potential common shares have been excluded from
the computation of diluted income (loss) per share as of March 2, 2013, March 3, 2012 and
February 26, 2011:
Year Ended
March 2, March 3, February 26,
2013 2012 2011
(52 Weeks) (53 Weeks) (52 Weeks)
Stock options .......................... 10,455 73,798 74,298
Convertible preferred stock ................ 33,109 31,195 29,391
Convertible notes ....................... 24,800 24,800 24,800
68,364 129,793 128,489
Also excluded from the computation of diluted income (loss) per share as of March 3, 2012 and
February 26, 2011 are restricted shares and restricted stock units of 11,506, and 7,078 which are
included in shares outstanding.
75