Rite Aid 2013 Annual Report Download - page 67
Download and view the complete annual report
Please find page 67 of the 2013 Rite Aid annual report below. You can navigate through the pages in the report by either clicking on the pages listed below, or by using the keyword search tool below to find specific information within the annual report.-
 1
1 -
2
-
3
-
4
-
5
-
6
-
7
-
8
-
9
-
10
-
11
-
12
-
13
-
14
-
15
-
16
-
17
-
18
-
19
-
20
-
21
-
22
-
23
-
24
-
25
-
26
-
27
-
28
-
29
-
30
-
31
-
32
-
33
-
34
-
35
-
36
-
37
-
38
-
39
-
40
-
41
-
42
-
43
-
44
-
45
-
46
-
47
-
48
-
49
-
50
-
51
-
52
-
53
-
54
-
55
-
56
-
 57
57 -
 58
58 -
 59
59 -
 60
60 -
 61
61 -
 62
62 -
 63
63 -
 64
64 -
 65
65 -
 66
66 -
 67
67 -
 68
68 -
 69
69 -
 70
70 -
 71
71 -
 72
72 -
 73
73 -
 74
74 -
 75
75 -
 76
76 -
 77
77 -
78
-
79
-
80
-
81
-
82
-
83
-
84
-
85
-
86
-
87
-
88
-
89
-
90
-
91
-
92
-
93
-
94
-
95
-
96
-
97
-
98
-
99
-
100
-
101
-
102
-
103
-
104
-
105
-
106
-
107
-
108
-
109
-
110
-
111
-
112
-
113
-
114
-
115
-
116
-
117
-
118
-
119
-
120
-
121
-
122
-
123
-
124
-
125
 |
 |

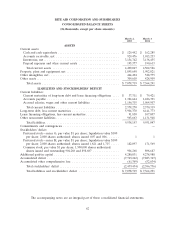
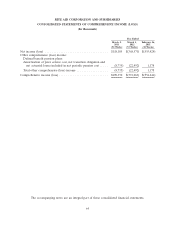
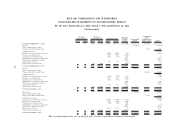
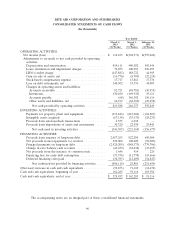
RITE AID CORPORATION AND SUBSIDIARIES
CONSOLIDATED STATEMENTS OF CASH FLOWS
(In thousands)
Year Ended
March 2, March 3, February 26,
2013 2012 2011
(52 Weeks) (53 Weeks) (52 Weeks)
OPERATING ACTIVITIES:
Net income (loss) ................................. $ 118,105 $(368,571) $(555,424)
Adjustments to reconcile to net cash provided by operating
activities:
Depreciation and amortization ...................... 414,111 440,582 505,546
Lease termination and impairment charges ............. 70,859 100,053 210,893
LIFO (credit) charge ............................. (147,882) 188,722 44,905
Gain on sale of assets, net ......................... (16,776) (8,703) (22,224)
Stock-based compensation expense ................... 17,717 15,861 17,336
Loss on debt retirements, net ....................... 140,502 33,576 44,003
Changes in operating assets and liabilities:
Accounts receivable ............................ 82,721 (48,781) (10,955)
Inventories .................................. 130,100 (169,935) 35,111
Accounts payable .............................. (68) 146,302 156,116
Other assets and liabilities, net .................... 10,199 (62,569) (29,458)
Net cash provided by operating activities ........... 819,588 266,537 395,849
INVESTING ACTIVITIES:
Payments for property, plant and equipment ............ (315,846) (215,004) (162,287)
Intangible assets acquired ......................... (67,134) (35,133) (24,233)
Proceeds from sale-leaseback transactions .............. 6,355 6,038 —
Proceeds from dispositions of assets and investments ...... 30,320 22,930 29,843
Net cash used in investing activities ............... (346,305) (221,169) (156,677)
FINANCING ACTIVITIES:
Proceeds from issuance of long-term debt .............. 2,057,263 822,285 650,000
Net proceeds from (repayments to) revolver ............ 529,000 108,000 (52,000)
Principal payments on long-term debt ................. (2,920,209) (848,373) (779,706)
Change in zero balance cash accounts ................ (43,659) (32,838) (15,657)
Net proceeds from the issuance of common stock ........ 1,646 914 226
Financing fees for early debt redemption .............. (75,374) (11,778) (19,666)
Deferred financing costs paid ....................... (54,783) (12,409) (34,847)
Net cash(used in) provided by financing activities ..... (506,116) 25,801 (251,650)
(Decrease) increase in cash and cash equivalents ............ (32,833) 71,169 (12,478)
Cash and cash equivalents, beginning of year ............... 162,285 91,116 103,594
Cash and cash equivalents, end of year ................... $ 129,452 $ 162,285 $ 91,116
The accompanying notes are an integral part of these consolidated financial statements.
66