Rite Aid 2013 Annual Report Download - page 118
Download and view the complete annual report
Please find page 118 of the 2013 Rite Aid annual report below. You can navigate through the pages in the report by either clicking on the pages listed below, or by using the keyword search tool below to find specific information within the annual report.-
 1
1 -
2
-
3
-
4
-
5
-
6
-
7
-
8
-
9
-
10
-
11
-
12
-
13
-
14
-
15
-
16
-
17
-
18
-
19
-
20
-
21
-
22
-
23
-
24
-
25
-
26
-
27
-
28
-
29
-
30
-
31
-
32
-
33
-
34
-
35
-
36
-
37
-
38
-
39
-
40
-
41
-
42
-
43
-
44
-
45
-
46
-
47
-
48
-
49
-
50
-
51
-
52
-
53
-
54
-
55
-
56
-
57
-
58
-
59
-
60
-
61
-
62
-
63
-
64
-
65
-
66
-
67
-
68
-
69
-
70
-
71
-
72
-
73
-
74
-
75
-
76
-
77
-
78
-
79
-
80
-
81
-
82
-
83
-
84
-
85
-
86
-
87
-
88
-
89
-
90
-
91
-
92
-
93
-
94
-
95
-
96
-
97
-
98
-
99
-
100
-
101
-
102
-
103
-
104
-
105
-
106
-
107
-
 108
108 -
 109
109 -
 110
110 -
 111
111 -
 112
112 -
 113
113 -
 114
114 -
 115
115 -
 116
116 -
 117
117 -
 118
118 -
 119
119 -
 120
120 -
 121
121 -
 122
122 -
 123
123 -
 124
124 -
 125
125
 |
 |

Exhibit 12
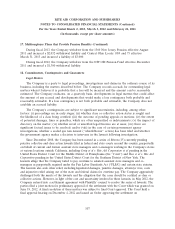
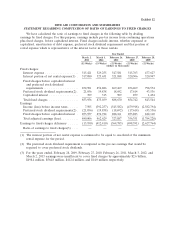
RITE AID CORPORATION AND SUBSIDIARIES
STATEMENT REGARDING COMPUTATION OF RATIO OF EARNINGS TO FIXED CHARGES
We have calculated the ratio of earnings to fixed charges in the following table by dividing
earnings by fixed charges. For this purpose, earnings include pre-tax income from continuing operations
plus fixed charges, before capitalized interest. Fixed charges include interest, whether expensed or
capitalized, amortization of debt expense, preferred stock dividend requirement and that portion of
rental expense which is representative of the interest factor in those rentals.
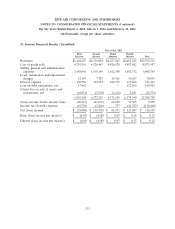
Year Ended
March 2, March 3, February 26, February 27, February 28,
2013 2012 2011 2010 2009
(52 Weeks) (53 Weeks) (52 Weeks) (52 Weeks) (52 Weeks)
(dollars in thousands)
Fixed charges:
Interest expense ................... 515,421 529,255 547,581 515,763 477,627
Interest portion of net rental expense(1) . 317,080 325,631 321,888 320,506 320,947
Fixed charges before capitalized interest
and preferred stock dividend
requirements .................... 832,501 854,886 869,469 836,269 798,574
Preferred stock dividend requirements(2) . 21,056 19,838 18,692 17,614 43,536
Capitalized interest ................. 399 315 509 859 1,434
Total fixed charges ................. 853,956 875,039 888,670 854,742 843,544
Earnings:
Income (loss) before income taxes ...... 7,505 (392,257) (545,582) (479,918) (2,582,794)
Preferred stock dividend requirements(2) . (21,056) (19,838) (18,692) (17,614) (43,536)
Fixed charges before capitalized interest . 853,557 874,724 888,161 853,883 842,110
Total adjusted earnings (loss) .......... 840,006 462,629 323,887 356,351 (1,784,220)
Earnings to fixed charges deficiency ...... (13,950) (412,410) (564,783) (498,391) (2,627,764)
Ratio of earnings to fixed charges(3) .... — — — — —
(1) The interest portion of net rental expense is estimated to be equal to one-third of the minimum
rental expense for the period.
(2) The preferred stock dividend requirement is computed as the pre-tax earnings that would be
required to cover preferred stock dividends.
(3) For the years ended, February 28, 2009, February 27, 2010, February 26, 2011, March 3, 2012, and
March 2, 2013 earnings were insufficient to cover fixed charges by approximately $2.6 billion,
$498.4 million, $564.8 million, $412.4 million, and $14.0 million respectively.