Rite Aid 2013 Annual Report Download - page 27
Download and view the complete annual report
Please find page 27 of the 2013 Rite Aid annual report below. You can navigate through the pages in the report by either clicking on the pages listed below, or by using the keyword search tool below to find specific information within the annual report.-
 1
1 -
2
-
3
-
4
-
5
-
6
-
7
-
8
-
9
-
10
-
11
-
12
-
13
-
14
-
15
-
16
-
 17
17 -
 18
18 -
 19
19 -
 20
20 -
 21
21 -
 22
22 -
 23
23 -
 24
24 -
 25
25 -
 26
26 -
 27
27 -
 28
28 -
 29
29 -
 30
30 -
 31
31 -
 32
32 -
 33
33 -
 34
34 -
 35
35 -
 36
36 -
 37
37 -
38
-
39
-
40
-
41
-
42
-
43
-
44
-
45
-
46
-
47
-
48
-
49
-
50
-
51
-
52
-
53
-
54
-
55
-
56
-
57
-
58
-
59
-
60
-
61
-
62
-
63
-
64
-
65
-
66
-
67
-
68
-
69
-
70
-
71
-
72
-
73
-
74
-
75
-
76
-
77
-
78
-
79
-
80
-
81
-
82
-
83
-
84
-
85
-
86
-
87
-
88
-
89
-
90
-
91
-
92
-
93
-
94
-
95
-
96
-
97
-
98
-
99
-
100
-
101
-
102
-
103
-
104
-
105
-
106
-
107
-
108
-
109
-
110
-
111
-
112
-
113
-
114
-
115
-
116
-
117
-
118
-
119
-
120
-
121
-
122
-
123
-
124
-
125
 |
 |
Item 7. Management’s Discussion and Analysis of Financial Condition and Results of Operations
Overview
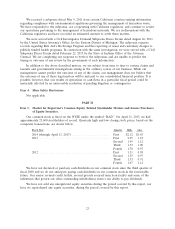
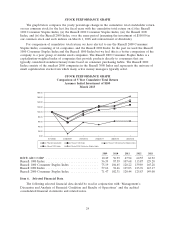
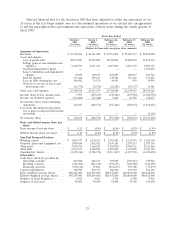
Net income for fiscal 2013 was $118.1 million or $0.12 per basic and diluted share, compared to
net loss for fiscal 2012 of $368.6 million or $0.43 per basic and diluted share and a net loss for fiscal
2011 of $555.4 million or $0.64 per basic and diluted share. The substantial improvement in our
operating results is driven primarily by script count growth, the gross profit benefit from introductions
of new generics and a current year LIFO credit of $147.9 million as compared to a charge last year,
partially offset by higher selling, general and administrative expenses (‘‘SG&A’’). Our operating results
are described in more detail in the ‘‘Results of Operations’’ section below. Some of the key factors that
impacted our results in fiscal 2013, 2012 and 2011 are summarized as follows:
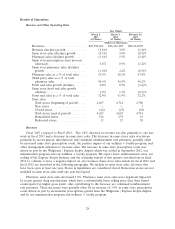
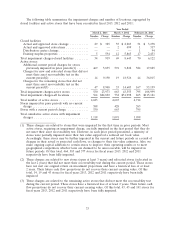
Sales Trends: Our revenue decline for fiscal 2013 was 2.8% compared to revenue growth of 3.6%
for fiscal 2012 and a revenue decline of 1.8% for fiscal 2011. Fiscal 2013 revenues were negatively
impacted by the extra week in fiscal 2012 and recent generic introductions, which have a substantially
lower selling price than their brand counterparts, as well as continued reimbursement pressures. These
decreases were partially offset by an increase of 3.4% in same store prescription count.
Gross Profit: Our gross profit was positively impacted by recent generic introductions, which have
a higher gross profit than their brand counterparts, increased same store prescription count and a
current year LIFO credit. We record the value of our inventory on the Last-In, First-Out (LIFO)
method. We recorded a non-cash LIFO credit of $147.9 million, a non-cash LIFO charge of
$188.7 million and a non-cash LIFO charge of $44.9 million in fiscal 2013, 2012 and 2011, respectively.
The current year LIFO credit was due to significant generic drug deflation, partially offset by normal
inflation on both brand drugs and front end products.
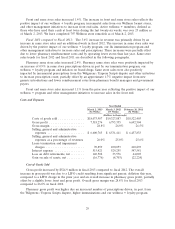
Selling, General and Administrative Expenses: Our selling, general and administrative expenses
(‘‘SG&A’’) increased in fiscal 2013 due primarily to the reversal of certain tax indemnification assets
partially offset by lower operating costs associated with one less week this year. SG&A expenses as a
percentage of revenue was 26.0% in fiscal 2013 compared to 25.0% in fiscal 2012. The increase in
SG&A as a percentage of revenues relative to the prior year is due in part to the continued impact of
recent generic introductions and reimbursement rate pressures which has resulted in a lower revenue
base to measure our SG&A expenses against.
Lease Termination and Impairment Charges: We recorded lease terminations and impairment
charges of $70.9 million in fiscal 2013 compared to $100.1 million and $210.9 million in fiscal 2012 and
2011, respectively. Our charges have been trending lower due to improved results of operations which
reduces our impairment charges and closing fewer stores requiring lease termination charges.
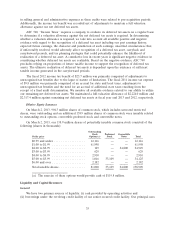
Debt Refinancing: During fiscal 2013, we continued to take steps to extend the terms of our debt,
reduce interest costs and to obtain more flexibility and we expect to engage in similar efforts in the
future. During fiscal 2013, we completed two debt refinancings.
In February 2013, we increased our senior secured revolving credit facility to $1.795 billion, with an
extended maturity of February 2018, and obtained new first and second priority secured term loans of
$1.161 billion due 2020 and $470.0 million due 2020, respectively. The proceeds from these new
borrowings, along with available cash, were used to refinance $1.370 billion of term loans and
$1.060 billion aggregate principal of senior secured notes and debentures. This transaction resulted in a
loss on debt retirement of $122.7 million which was recorded in the fourth quarter. This refinancing
extends maturities and will reduce annual interest expense by $60.0 million.
In February 2012, we issued $481.0 million of our 9.25% senior notes due March 2020 and in May
2012, we issued an additional $421.0 million of our 9.25% senior notes due 2020. The proceeds of the
notes, together with available cash were used to repurchase and repay the 8.625% senior notes due
26