Redbox 2012 Annual Report Download - page 79
Download and view the complete annual report
Please find page 79 of the 2012 Redbox annual report below. You can navigate through the pages in the report by either clicking on the pages listed below, or by using the keyword search tool below to find specific information within the annual report.-
 1
1 -
2
-
3
-
4
-
5
-
6
-
7
-
8
-
9
-
10
-
11
-
12
-
13
-
14
-
15
-
16
-
17
-
18
-
19
-
20
-
21
-
22
-
23
-
24
-
25
-
26
-
27
-
28
-
29
-
30
-
31
-
32
-
33
-
34
-
35
-
36
-
37
-
38
-
39
-
40
-
41
-
42
-
43
-
44
-
45
-
46
-
47
-
48
-
49
-
50
-
51
-
52
-
53
-
54
-
55
-
56
-
57
-
58
-
59
-
60
-
61
-
62
-
63
-
64
-
65
-
66
-
67
-
68
-
 69
69 -
 70
70 -
 71
71 -
 72
72 -
 73
73 -
 74
74 -
 75
75 -
 76
76 -
 77
77 -
 78
78 -
 79
79 -
 80
80 -
 81
81 -
 82
82 -
 83
83 -
 84
84 -
 85
85 -
 86
86 -
 87
87 -
 88
88 -
 89
89 -
90
-
91
-
92
-
93
-
94
-
95
-
96
-
97
-
98
-
99
-
100
-
101
-
102
-
103
-
104
-
105
 |
 |

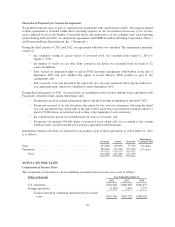
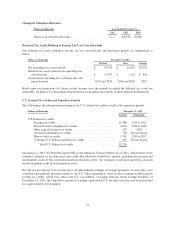
Tax Years Open for Examination
As of December 31, 2012 for our major tax jurisdictions, the years 2009 and 2011 were open for examination by
U.S. Federal and most state tax authorities. Additionally, the years 2002 to 2008 are subject to examination, to
the extent that net operating loss and income tax credit carryforwards from those years were utilized in 2009 and
later years.
Jurisdiction
As of December 31, 2012
Open Tax Years
U.S. 2002 through 2011
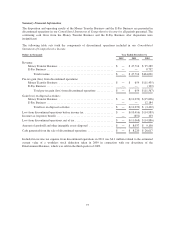
Deferred Income Taxes
Deferred income tax assets and liabilities reflect the net tax effects of temporary differences between the carrying
amounts of assets and liabilities for financial reporting purposes and the carrying amounts used for income tax
purposes. Future tax benefits for net operating loss and tax credit carryforwards are also recognized to the extent
that realization of such benefits is more likely than not.
In determining our tax provisions, management determined the deferred tax assets and liabilities for each
separate tax jurisdiction and considered a number of factors including the positive and negative evidence
regarding the realization of our deferred tax assets to determine whether a valuation allowance should be
recognized with respect to our deferred tax assets. As of December 31, 2012, a valuation allowance was not
necessary as positive evidence outweighed negative evidence that those deferred tax assets were more likely than
not to be realized.
Significant components of our deferred tax assets and liabilities and the net increase (decrease) in the valuation
allowance were as follows. Tax loss carryforwards for 2011 have been revised to reflect an adjustment identified
related to 2009. See the Revision of Previously Issued Financial Statements section of Note 2: Summary of
Significant Accounting Policies for more information.
Dollars in thousands December 31,
2012 2011
Deferred tax assets:
Income tax loss carryforwards ........................ $ 20,356 $ 65,006
Credit carryforwards ................................ 9,226 6,372
Accrued liabilities and allowances ..................... 18,455 21,628
Stock-based compensation ........................... 12,783 7,953
Intangible assets ................................... 14,004 24,316
Other ............................................ 6,175 3,490
Total deferred tax assets ................................. 80,999 128,765
Deferred tax liabilities:
Property and equipment ............................. (115,381) (123,947)
Product costs ...................................... (36,837) —
Investment basis ................................... (6,906) —
Convertible debt interest ............................. (5,066) (7,783)
Total deferred tax liabilities .............................. (164,190) (131,730)
Net deferred tax liabilities ............................... $ (83,191) $ (2,965)
72