Redbox 2012 Annual Report Download - page 44
Download and view the complete annual report
Please find page 44 of the 2012 Redbox annual report below. You can navigate through the pages in the report by either clicking on the pages listed below, or by using the keyword search tool below to find specific information within the annual report.-
 1
1 -
2
-
3
-
4
-
5
-
6
-
7
-
8
-
9
-
10
-
11
-
12
-
13
-
14
-
15
-
16
-
17
-
18
-
19
-
20
-
21
-
22
-
23
-
24
-
25
-
26
-
27
-
28
-
29
-
30
-
31
-
32
-
33
-
 34
34 -
 35
35 -
 36
36 -
 37
37 -
 38
38 -
 39
39 -
 40
40 -
 41
41 -
 42
42 -
 43
43 -
 44
44 -
 45
45 -
 46
46 -
 47
47 -
 48
48 -
 49
49 -
 50
50 -
 51
51 -
 52
52 -
 53
53 -
 54
54 -
55
-
56
-
57
-
58
-
59
-
60
-
61
-
62
-
63
-
64
-
65
-
66
-
67
-
68
-
69
-
70
-
71
-
72
-
73
-
74
-
75
-
76
-
77
-
78
-
79
-
80
-
81
-
82
-
83
-
84
-
85
-
86
-
87
-
88
-
89
-
90
-
91
-
92
-
93
-
94
-
95
-
96
-
97
-
98
-
99
-
100
-
101
-
102
-
103
-
104
-
105
 |
 |

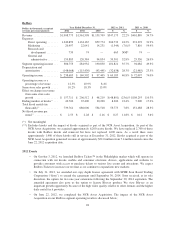
Free Cash Flow from Continuing Operations
Our non-GAAP financial measure free cash flow from continuing operations is defined as net cash provided by
operating activities from continuing operations after capital expenditures. We believe free cash flow from
continuing operations is an important non-GAAP measure as it provides additional information to users of the
financial statements regarding our ability to service, incur or pay down indebtedness and repurchase our common
stock. The table below provides a reconciliation of net cash provided by operating activities from continuing
operations, the most comparable GAAP financial measure, to free cash flow from continuing operations:
Dollars in thousands Year Ended December 31, 2012 vs. 2011 2011 vs. 2010
2012 2011 2010 $ % $ %
Net cash provided by operating
activities ..................... $463,906 $ 406,516 $ 315,619 $ 57,390 14.1% $90,897 28.8%
Purchase of property and
equipment .................... (208,054) (179,236) (170,847) (28,818) 16.1% (8,389) 4.9%
Free cash flow from continuing
operations .................... $255,852 $ 227,280 $ 144,772 $ 28,572 12.6% $82,508 57.0%
An analysis of our net cash from operating activities and used in investing and financial activities from
continuing operations is provided below.
Liquidity and Capital Resources
We believe our existing cash, cash equivalents and amounts available to us under our credit facility will be
sufficient to fund our cash requirements and capital expenditure needs for at least the next 12 months. After that
time, the extent of additional financing needed, if any, will depend on the success of our business. If we
significantly increase kiosk installations beyond planned levels or if our Redbox or Coin kiosks generate lower
than historical volume, then our cash needs may increase. Furthermore, our future capital requirements will
depend on a number of factors, including consumer use of our services, the timing and number of machine
installations, the number of available installable kiosks, the type and scope of service enhancements and the cost
of developing potential new product service offerings and enhancements and cash required to fund future
acquisitions and investment. We intend to continually explore ways to enhance our capital structure, including
through potential debt issuances, which we may use to add cash to our balance sheet, for general corporate
purposes or to fund repayment of our existing debt.
Net Cash from Operating Activities from Continuing Operations
Our net cash from operating activities from continuing operations increased by $57.4 million in 2012 compared
to 2011 primarily due to the following:
• $46.3 million increase in net income to $150.2 million primarily due to increased operating income in
our Redbox segment;
• $52.4 million net increase in non-cash expenses to $296.0 million primarily due to increased
depreciation on kiosks and higher deferred income taxes; and a
• $41.4 million net decrease in cash flows from changes in working capital to $17.6 million primarily
due to the procurement of our content library and timing of payments to retailers.
Net Cash Used in Investing Activities from Continuing Operations
We used $346.7 million of net cash in our investing activities from continuing operations during 2012 primarily
due to the following:
• $208.1 million used for purchases of property and equipment for kiosks and corporate infrastructure,
including information technology related to our ERP system implementation;
37