Redbox 2012 Annual Report Download - page 54
Download and view the complete annual report
Please find page 54 of the 2012 Redbox annual report below. You can navigate through the pages in the report by either clicking on the pages listed below, or by using the keyword search tool below to find specific information within the annual report.-
 1
1 -
2
-
3
-
4
-
5
-
6
-
7
-
8
-
9
-
10
-
11
-
12
-
13
-
14
-
15
-
16
-
17
-
18
-
19
-
20
-
21
-
22
-
23
-
24
-
25
-
26
-
27
-
28
-
29
-
30
-
31
-
32
-
33
-
34
-
35
-
36
-
37
-
38
-
39
-
40
-
41
-
42
-
43
-
 44
44 -
 45
45 -
 46
46 -
 47
47 -
 48
48 -
 49
49 -
 50
50 -
 51
51 -
 52
52 -
 53
53 -
 54
54 -
 55
55 -
 56
56 -
 57
57 -
 58
58 -
 59
59 -
 60
60 -
 61
61 -
 62
62 -
 63
63 -
 64
64 -
65
-
66
-
67
-
68
-
69
-
70
-
71
-
72
-
73
-
74
-
75
-
76
-
77
-
78
-
79
-
80
-
81
-
82
-
83
-
84
-
85
-
86
-
87
-
88
-
89
-
90
-
91
-
92
-
93
-
94
-
95
-
96
-
97
-
98
-
99
-
100
-
101
-
102
-
103
-
104
-
105
 |
 |

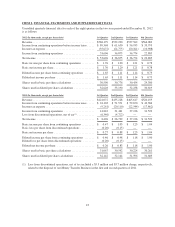
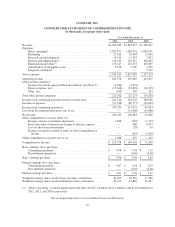
COINSTAR, INC.
CONSOLIDATED STATEMENTS OF COMPREHENSIVE INCOME
(in thousands, except per share data)
Year Ended December 31,
2012 2011 2010
Revenue ................................................... $2,202,043 $1,845,372 $1,436,421
Expenses:
Direct operating(1) ....................................... 1,502,977 1,283,351 1,000,941
Marketing ............................................. 27,635 29,004 23,836
Research and development ................................ 13,913 11,557 7,437
General and administrative ................................ 210,235 163,357 128,629
Depreciation and other(1) .................................. 179,147 145,478 123,687
Amortization of intangible assets ........................... 5,378 2,740 3,305
Litigation settlement ..................................... — — 5,379
Total expenses .............................................. 1,939,285 1,635,487 1,293,214
Operating income ........................................... 262,758 209,885 143,207
Other income (expense):
Income (loss) from equity method investments, net (Note 5) ...... (5,184) (1,591) —
Interest expense, net ..................................... (15,648) (23,822) (34,705)
Other, net .............................................. (180) 256 424
Total other income (expense) .................................. (21,012) (25,157) (34,281)
Income from continuing operations before income taxes ............. 241,746 184,728 108,926
Income tax expense .......................................... (91,516) (69,777) (43,032)
Income from continuing operations ............................. 150,230 114,951 65,894
Loss from discontinued operations, net of tax ..................... — (11,068) (14,886)
Net income ................................................ 150,230 103,883 51,008
Other comprehensive income (Note 14):
Foreign currency translation adjustment ...................... 1,048 (255) (1,737)
Reclassification of interest rate hedges to interest expense ....... — 896 4,477
Loss on short-term investments ............................ — (20) 10
Income tax expense related to items of other comprehensive
income .............................................. — (342) (1,618)
Other comprehensive income, net of tax .......................... 1,048 279 1,132
Comprehensive income ....................................... $ 151,278 $ 104,162 $ 52,140
Basic earnings (loss) per share:
Continuing operations .................................... $ 4.96 $ 3.76 $ 2.11
Discontinued operations .................................. — (0.36) (0.48)
Basic earnings per share ...................................... $ 4.96 $ 3.40 $ 1.63
Diluted earnings (loss) per share:
Continuing operations .................................... $ 4.67 $ 3.61 $ 2.03
Discontinued operations .................................. — (0.35) (0.46)
Diluted earnings per share ..................................... $ 4.67 $ 3.26 $ 1.57
Weighted average shares used in basic per share calculations ......... 30,305 30,520 31,268
Weighted average shares used in diluted per share calculations ........ 32,174 31,869 32,397
(1) “Direct operating” excludes depreciation and other of $127.2 million, $121.2 million, and $110.0 million for
2012, 2011, and 2010 respectively.
See accompanying Notes to Consolidated Financial Statements
47